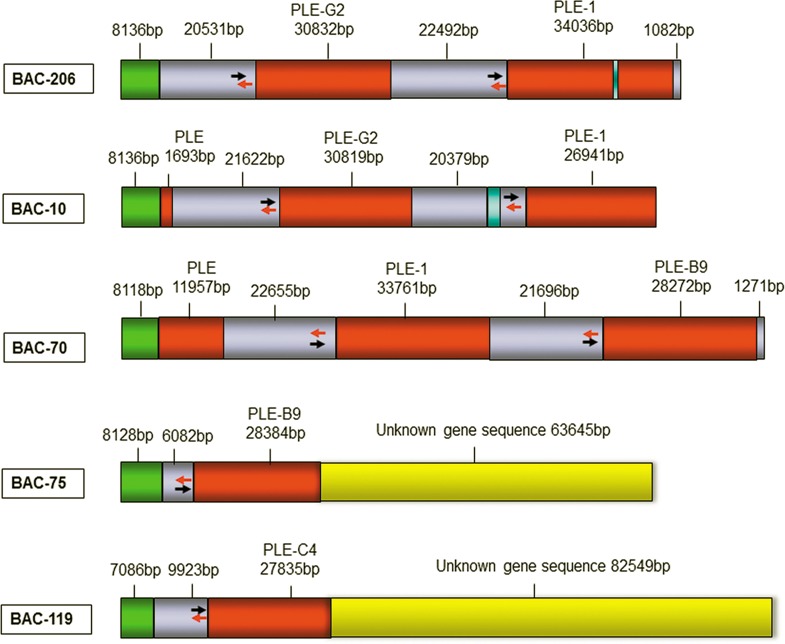
Fig 4. The pattern diagrams of five BAC positive plasmids.
Note: Red areas represent the sequences of PLE gene, Gray areas represent the intergenic sequence of PLE gene, Green areas represent the pCC1BAC sequence, Yellow areas represent unknown gene sequence, Orange areas represent partial pig CH242 gene sequence. Blue said missing sequence after comparing, The double arrows (red and black) indicate the reverse complementary sequence of PLE gene regulatory regions.

