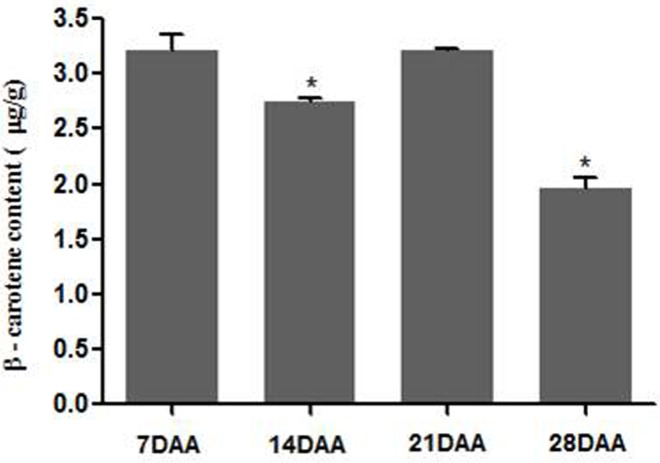
Fig 4. Estimation of β-carotene content in developing grains of wheat at different stages.
Analysis was performed by HPLC. Each bar indicates the mean of two to three replicates ±SD. Statistical significance was checked by using one-way analysis of variance (ANOVA) at p ≤ 0.05 denoted as *, with respect to the content in 7 DAA.

