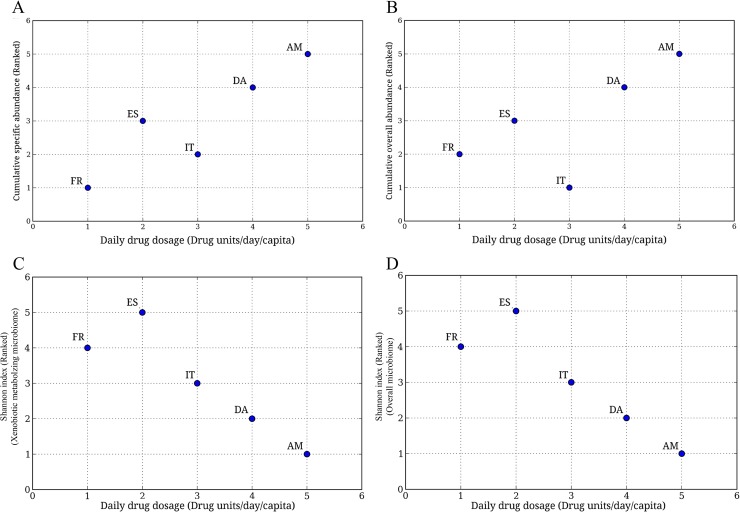
Fig 4. Variation of cumulative abundances of genera harboring xenobiotic metabolizing enzymes with ranked Daily Drug Dosage (DDD).
(A) Variation of ranked cumulative specific abundance with ranked DDD.Cumulative specific abundances of microbial genera of groups G1, G2 and G3 were calculated for each geography, namely, France (FR), Italy (IT), Spain (ES) and America (AM). The Cumulative specific abundance represents the abundance of each microbial genera in the xenobiotic metabolizing repertoire, and is obtained by calculating number of contigs (in the corresponding metagenome) showing hits against genes corresponding to xenobiotic metabolizing enzymes, assigned to a particular genera, normalized by total number of contigs in the metagenome. Median was calculated for each region and was ranked, and plotted against their respective daily drug dosage (ranked) obtained from earlier reports. A linear increase in abundance with increase in DDD was observed suggesting a role of drug consumption in modulating the abundances of xenobiotic metabolizing enzymes. Kruskal-Wallis H test was performed and the differences were found to be significant (p-value < 0.05). (B) Variation of ranked cumulative overall abundance with ranked DDD.Overall abundance of each genus, as a measure of contribution of each microbial genera, in the whole metagenome of each sample, was considered. Cumulative of the overall abundance of microbial genera of groups G1, G2 and G3 were calculated for each sample. Median was calculated for each region and was ranked and plotted against their respective daily drug dosage. A similar (linear) trend obtained, suggest a role of drug consumption in modulating the abundances of xenobiotic metabolizing microbes in the microbiome. Kruskal-Wallis H test was performed and the differences were found to be significant (p-value < 0.05).(C) Variation of Shannon index calculated for xenobiotic metabolizing microbiome with ranked DDD. Kruskal-Wallis H test was performed and the differences were found to be significant (p-value < 0.05).(D) Variation of Shannon index of overall microbiome with DDD. Kruskal-Wallis H test was performed and the differences were found to be significant (p-value < 0.05).

