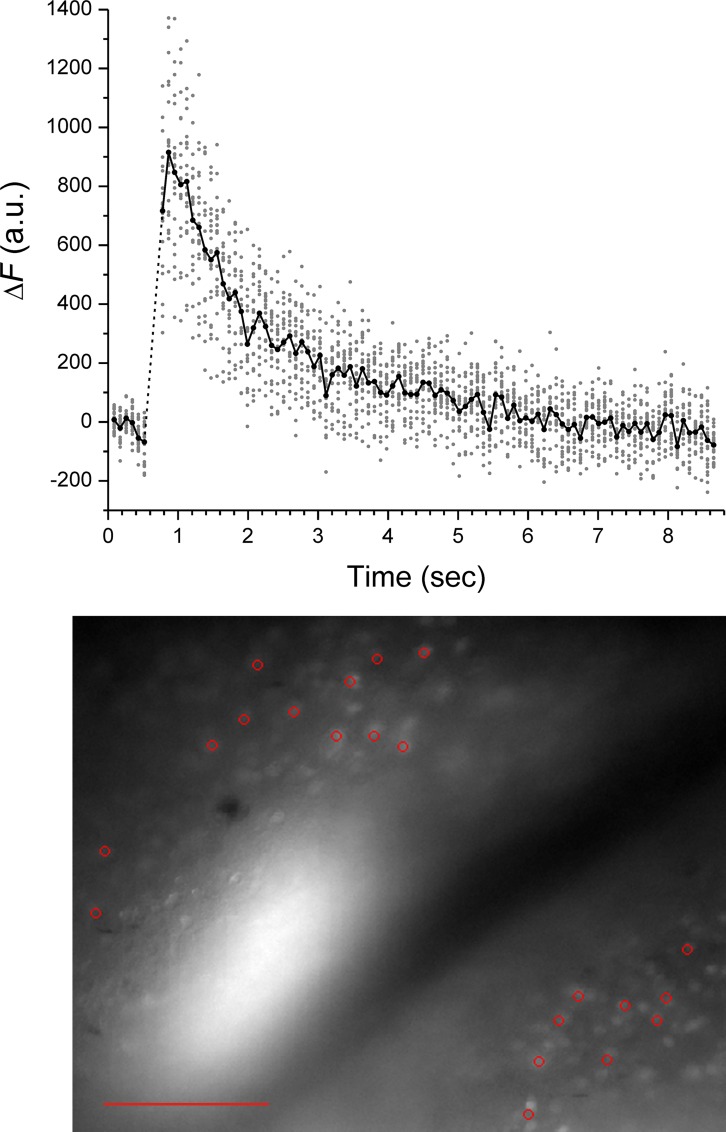
Fig 10. Response of neurons in cortical brain slice to photorelease of N-Ncm-Glu.
Neurons were loaded with the fluorescent Ca2+ indicator, OGB-1, for monitoring intracellular Ca2+ signals evoked by glutamate photorelease. In the fluorescence image, red circles mark 21 cells whose responses were analyzed; scale bar represents 100 μm. The center bright area is due to the optical fiber illumination. In the graph, change in OBG-1 fluorescence (ΔF) is plotted as function of time. Individual data are shown as gray points; the solid line is the average response of the 21 cells. A 50-ms laser pulse was used for photolysis. The dotted line indicates the interval during which the photolytic laser pulse precluded fluorescence data acquisition.

