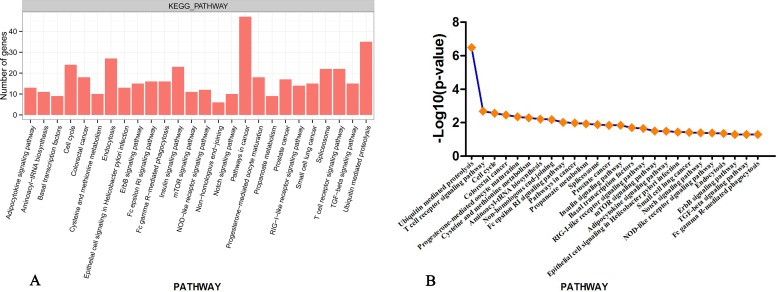
Fig 2. Summary of gene-significant differences in KEGG pathways.
(A)Distribution of the KEGG pathways of gene-significant differences is shown as a bar chart. The number of gene hits is shown along the Y-axis while the different KEGG pathways are shown along the X-axis. P<0.05 was used as the thresholds in selecting significant KEGG pathways.The 26 significantly different KEGG terms are shown. (B) P-value for KEGG pathways.

