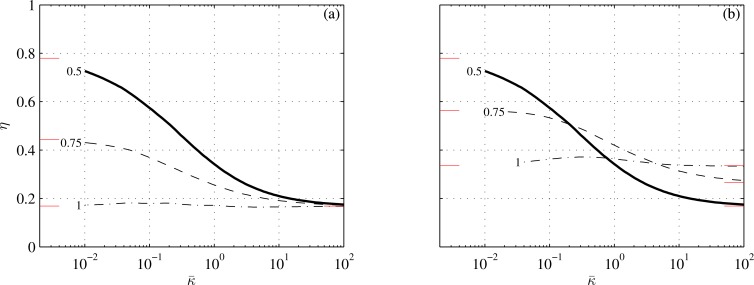
Fig 4. Propulsion efficiency as a function of reduced stiffness at three values of (shown next to respective lines).
Conditions are those of cases 2 and 3 in Table 1. In (a), st is constant; in (b), s2 is constant. The thick lines are the same as in Fig 2. Short lines adjacent to the left and right margins mark asymptotic values from Appendices E and F.

