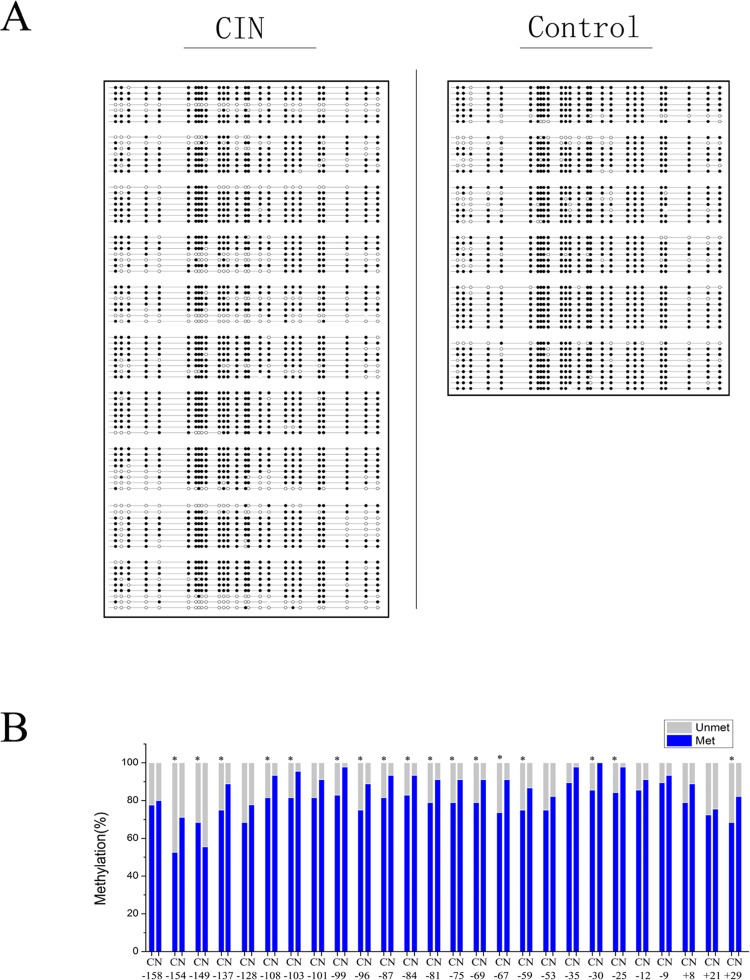
Fig 5. Sodium bisulfite sequencing showed the methylation status of the rRNA gene promoter in clinical CIN tissues as compared with non-cancerous tissues.
(A) Sodium bisulfite mapping of the rRNA gene promoter in region of -158 to +29 bp in 10 human CIN tissues and 6 non-cancerous tissues. Each row represents one clone. The filled circle represents methylated CpG dinucleotides and the open circle represents unmethylated CpG dinucleotides. (B) Hypomethylation of rDNA promoter in CIN tissues as compared with normal tissues showed by quantitative analysis of methylation density at each CpG. Theproportion of methylation (blue bar) and unmethylation (grey bar) for each CpG site for CIN tissues (N = 10) and non-cancerous tissues (N = 6) is showed. C represents the CIN tissue and N represents the non-cancerous tissue. Data are expressed as *P<0.05, measured by the t-test.

