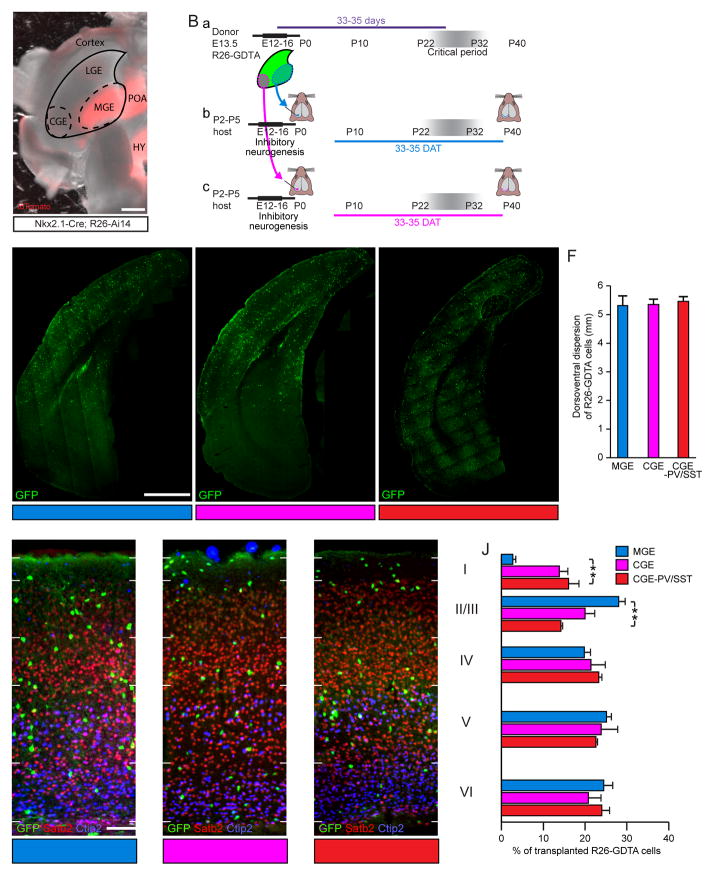
Figure 1. MGE and CGE Transplants Disperse Broadly in Neocortex and Demonstrate Laminar Distributions Consistent with their Lineages.
(A) Anatomical positions of MGE and CGE in E13.5 Nkx2.1-Cre;R26-Ai14 mouse brain (tdTomato expression recapitulates Nkx2.1 expression pattern and is shown here to demonstrate the spatial extent of MGE lineage neurons but was not used to guide dissection). Scale bar: 500 μm. POA, preoptic area; HY, hypothalamus.
(B) Cells were dissected from the MGE or CGE at E13.5 (a), dissociated, and transplanted into the visual cortex of P2–5 hosts. MGE (b) or CGE (c) transplant recipient brains were examined at 33–35DAT.
(C–E) Coronal brain sections stained for GFP at 35DAT to detect cells from anatomically isolated MGE (R26-GDTA donors; C), anatomically isolated CGE (R26-GDTA donors; D), or genetically isolated CGE (PV-Cre;SST-Cre;R26-GDTA donors; E) transplants. Scale bar: 1 mm.
(F) Dorsoventral dispersion in the host cortex at 35DAT of cells from anatomically isolated MGE (blue, n=5 mice), anatomically isolated CGE (magenta, n=5 mice), and genetically isolated CGE (red, n=4 mice) transplants. Error bars represent SEM. p=0.44 by Kruskal-Wallis test.
(G–I) Mouse brain sections co-stained for GFP, Satb2, and Ctip2 to reveal lamination of cells from anatomically isolated MGE (G), anatomically isolated CGE (H), and genetically isolated CGE (I) transplants at 35DAT in the host visual cortex. Scale bar: 100 μm.
(J) Proportion of cells from anatomically isolated MGE (n=5 mice), anatomically isolated CGE (n=3 mice), and genetically isolated CGE (n=3 mice) transplants found in each layer of the host visual cortex at 35DAT. Error bars represent SEM. Significance calculated using Bonferroni corrected t-tests.

