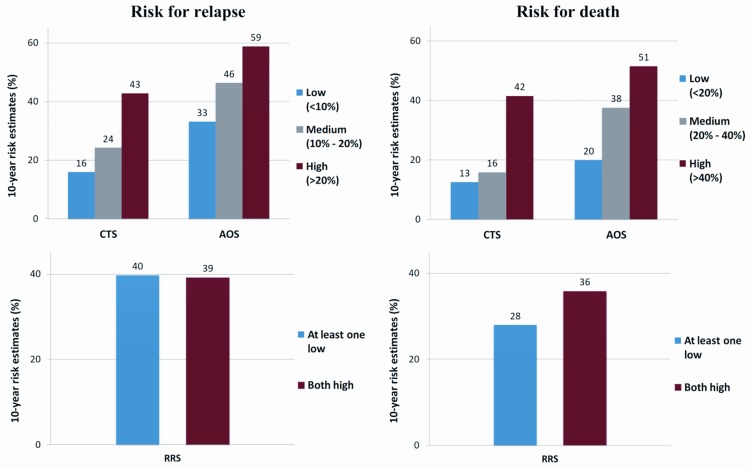
Fig 4. Ten-year risk estimates for CTS, AOS and RRS according to risk class categories.
Risk for relapse is shown in the left panels and risk for death in the right panels, according to low, medium and high CTS and AOS. For RRS, two risk classes were available, with the red bars representing the risk for patients with high mRNA expression for both RACGAP1 and TOP2A and the blue bars when at least one of the genes had low mRNA expression (numbers on bars: percent of 10-year risk estimate).

