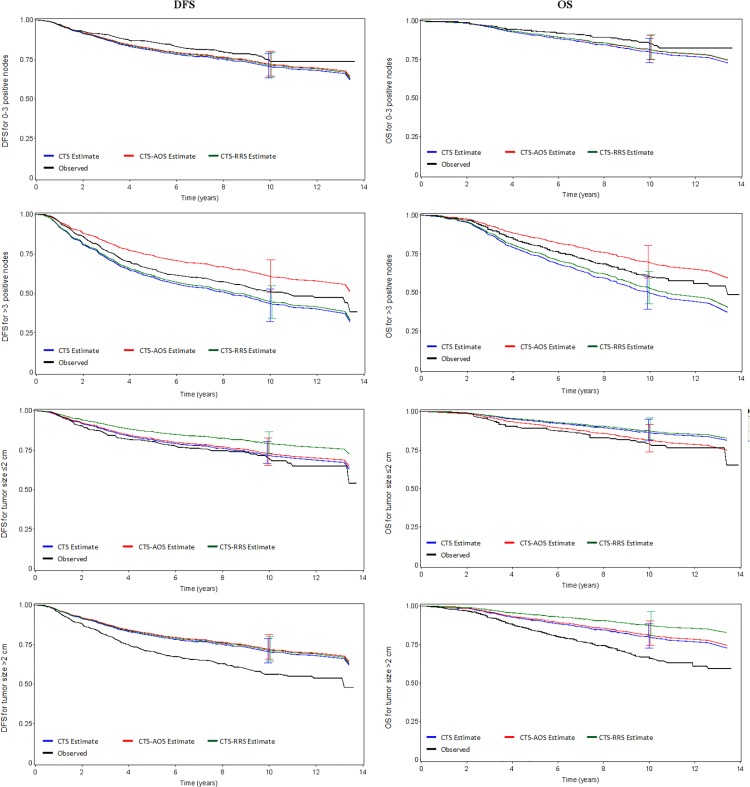
Fig 6. Observed versus predicted (estimated) DFS and OS probabilities for CTS, CTS+RRS and CTS+AOS.
Disease-free survival probabilities are shown in the left panels and overall survival probabilities in the right panels, according to the number of positive nodes (first four panels) and tumor size (last four panels). Vertical bars depict 95% confidence intervals of the predicted outcome at the 10-year time point.

