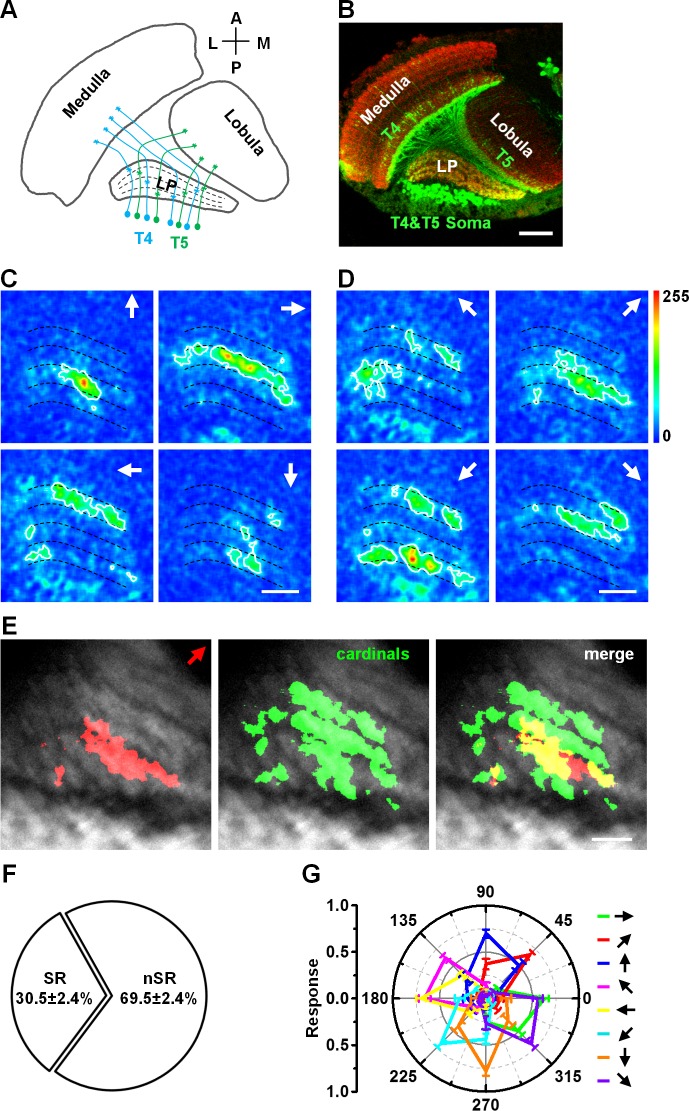
Fig 1. Diagonal motion activates selective response regions and non-selective response regions in the lobula plate.
(A) The schematic drawing shows the projections of T4 and T5 cells and their axon terminals in the lobula plate (LP). (B) Expression pattern of Gla4-R42F06 in the lobula plate. T4 and T5 cells are labeled with GFP and the neuropil is labeled by Mouse-anti-nc82 (red). Scale bar: 20 μm. (C) Topographic maps of T4 and T5 axon terminals responding to motion in the four cardinal directions (arrows indicate the directions). (D) Topographic maps of T4 and T5 axon terminals responding to motion in the four 45° diagonal directions. (E) Diagonal motion (45° frontward to upward) activates selective response (SR) regions (red area in the right panel) and non-selective response (nSR) regions (yellow area in the right panel). These regions are compared to those responding to the four cardinal directions of motion (Green area in the middle panel). (F) The proportions of the two region types activated by diagonal motion. Statistical significance was assessed using the two-sample t-test, p < 0.001. n = 15. (G) Intensities of responses for diagonal motions and cardinal directions of motion (colors represent areas selective to the indicated directions). n = 15. Data are presented as the mean ± SEM. Statistical significance was assessed using the Mann-Whitney U-test. Scale bar: 10 μm.

