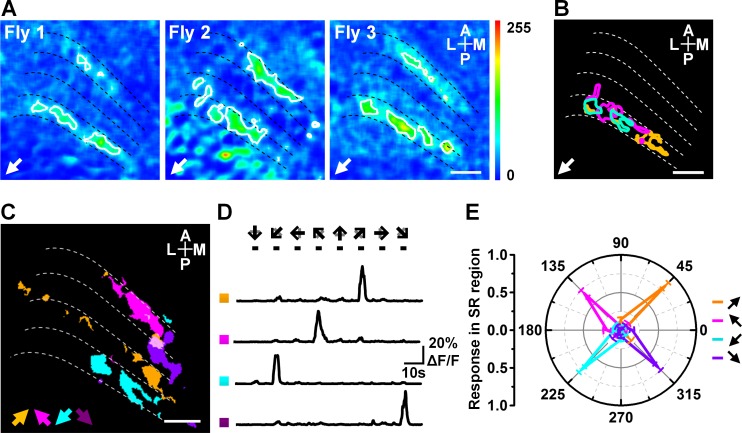
Fig 2. Locations and responses of the SR regions to diagonal motion.
(A) Topographic maps of the response to the 45° backward to downward diagonal motion obtained from three flies. (B) Compound representation of the three SR regions in (A). The yellow, magenta, and cyan circles indicate the SR regions responding to the 45° backward to downward motion in three flies. (C) Compound representation of the SR regions responding to motion in the four 45° diagonal directions. Arrows indicate directions. (D) Calcium transients from the four regions indicated in (C). Arrows indicate the direction of grating motion. (E) Intensities of the responses to the diagonal motions in SR regions. Data are presented as the mean ± SEM. Statistical significance was assessed using the Mann-Whitney U-test. n = 15. Scale bar: 10 μm.

