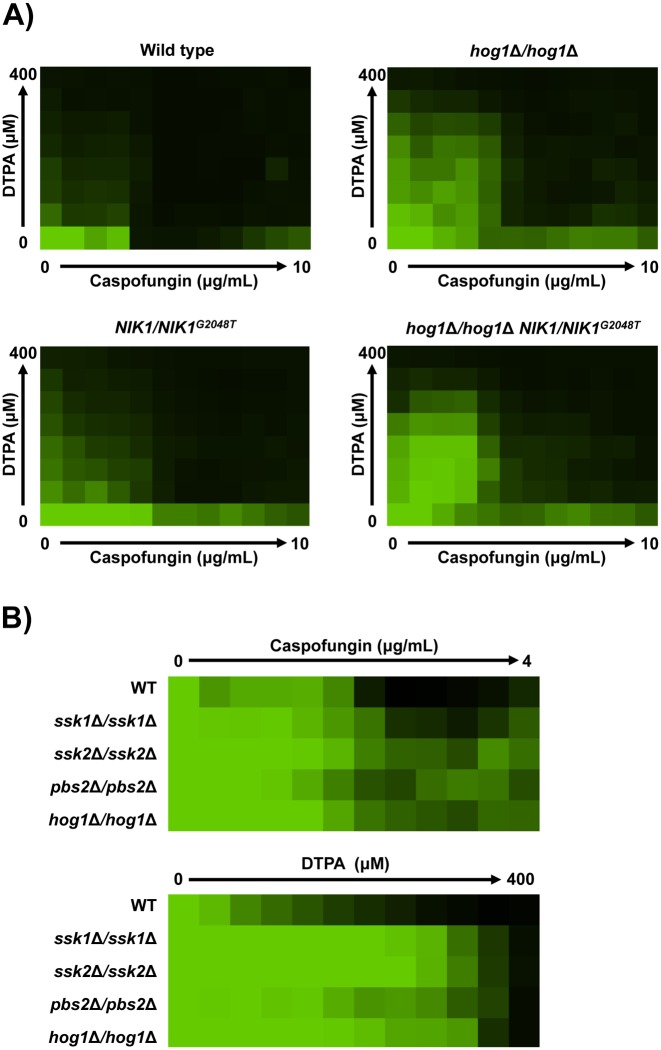
Fig 4. The NIK1G2048T allele phenocopies deletion of HOG1 or other components of the Hog1 signaling pathway.
A) Resistance phenotypes (wild type SN250) were assessed by checkerboard analysis in RPMI medium containing gradients of DTPA and caspofungin concentrations. Data was analyzed after 48 hours at 30°C and normalized to the no drug control. Data was displayed as a heat map, as in Fig 1. B) Susceptibility of each strain (wild type SN250) to either caspofungin or DTPA was assessed over a gradient of concentrations in an MIC assay. Assays were performed in RPMI medium, and data was analyzed after 72 hours at 30°C and normalized as in Fig 1.

