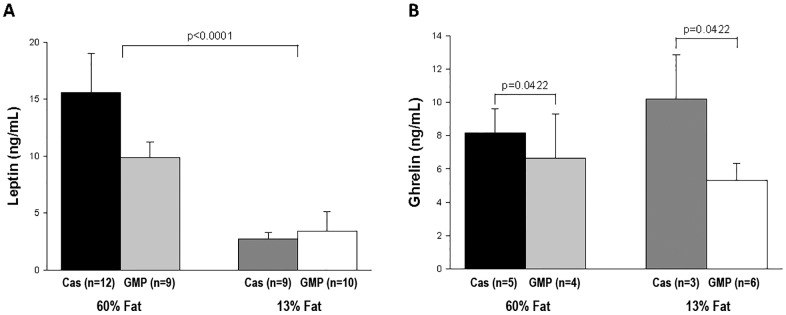
Fig 7. Plasma leptin and ghrelin concentrations.
Plasma concentrations of leptin (A) and ghrelin (B) in female mice fed 60%-fat casein, 60%-fat GMP, 13%-fat casein, and 13%-fat GMP diets. Values are means ± SE; nos. in parentheses indicate sample size. There was a significant fat effect in plasma leptin where mice fed the high-fat diets had a significantly greater leptin concentration than mice fed the control diets (p<0.0001). There was a significant protein effect in plasma ghrelin where mice fed the GMP diets had a significantly greater ghrelin concentration than mice fed the casein diets (p = 0.0422).

