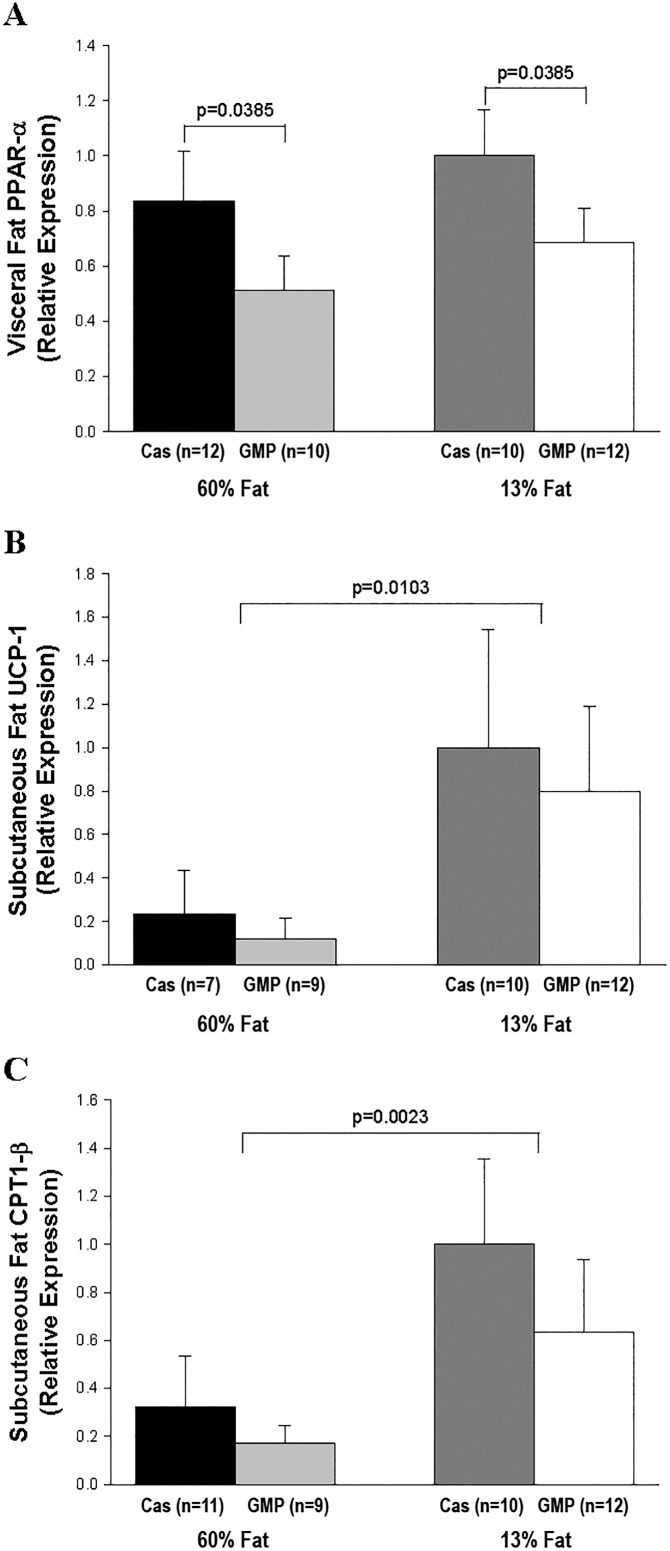
Fig 8. Relative expression of the genes PPAR-α, UCP-1, and CPT1-β.
Relative expression of the genes PPAR-α (A) in visceral fat tissue and UCP-1 (B) and CPT1-β (C) in subcutaneous fat tissue by quantitative real-time PCR. The expression levels have been normalized with the average expression of the control gene cyclophilin. There was a significant protein effect in relative expression of PPAR-α where mice fed the GMP diets have reduced relative expression compared to mice fed the casein diets. There was a significant fat effect in relative expression of UCP-1 and CPT1-β where mice fed the high-fat diets have reduced relative expression compared to mice fed the control diets.

