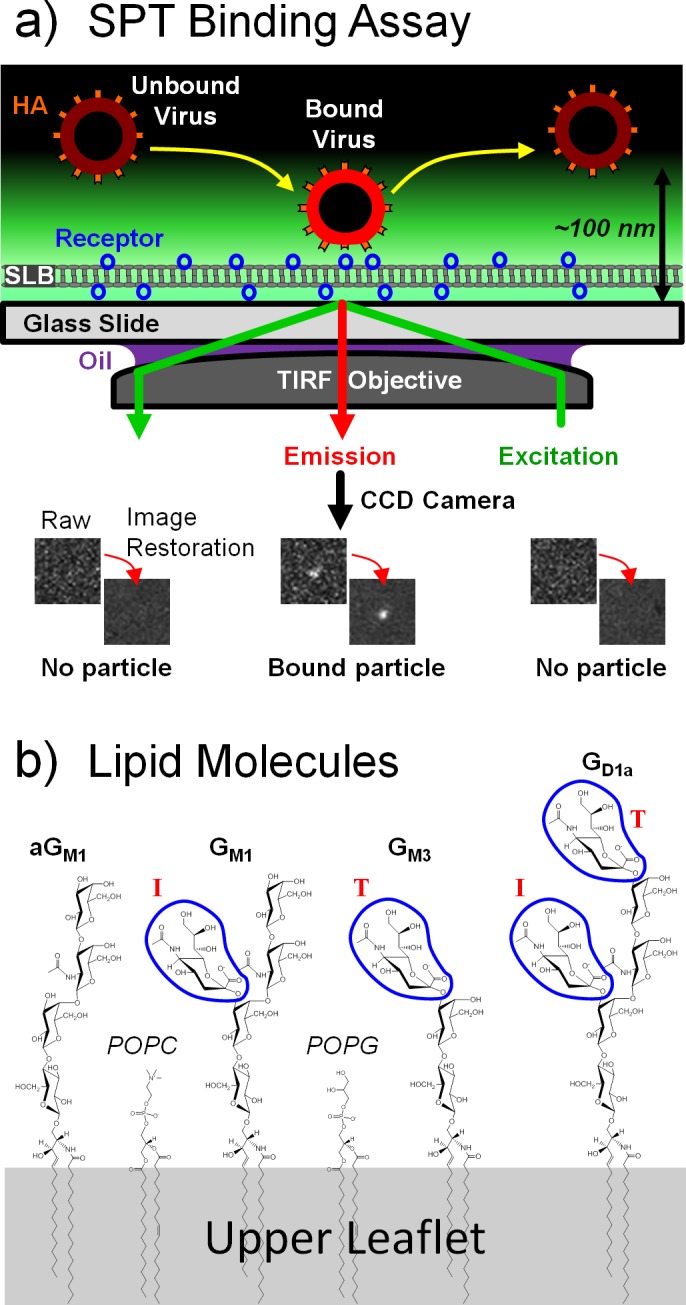
Fig 1. SPT binding assay and receptor structures.

a) Setup of SLB on TIRF microscope. Evanescent field illuminates regions where SLB and virus interacts. b) Structure of the sialic acid receptors for X31 tested here. The α2,3-linked sialic acid groups are circled by the blue perimeters. Following the notation by Suzuki et al. [16], sialic acid groups are labeled as either being in the internal (I) or terminal (T) position.
