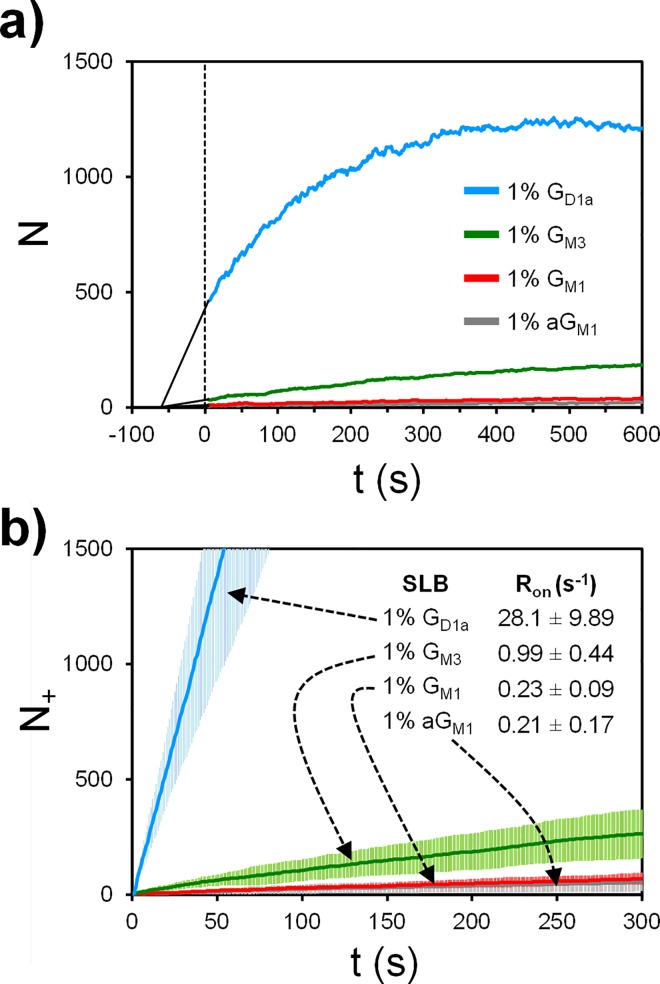
Fig 6. Two types of binding rate data of X31 to various receptors.
A) N vs t plots for one representative data set from a triplicate set. Negative time means time before recording, and the solid black lines are just an extrapolation to -60 s when the viruses are estimated to first reach the SLBs. B) N+ vs t plots, averaged over a triplicate set of data. The slope of this plot corresponds to binding frequency rate Ron. The error bars are the standard deviations, computed using 3 different trials.

