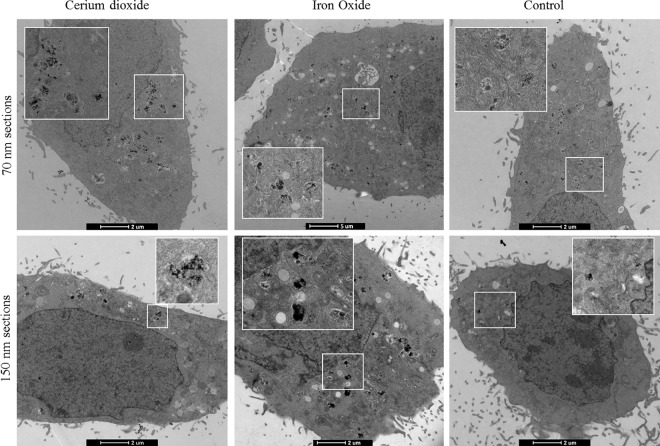
Fig 1.
Electron micrographs of A) cerium dioxide NPs, B) SPIONs, and C) Non-treated cells. The top panel depicts 70 nm ultrathin sections, the standard TEM mode, while the bottom panel uses 150 nm sections. Ultrathin and semi-thick sections can thus be successfully imaged. Thin sections give rise to a crisper image, with increased contrast visible at organelle boundaries. Thick sections have slightly less contrast due to the denser area being imaged but allow alignment with confocal slices (see below).

