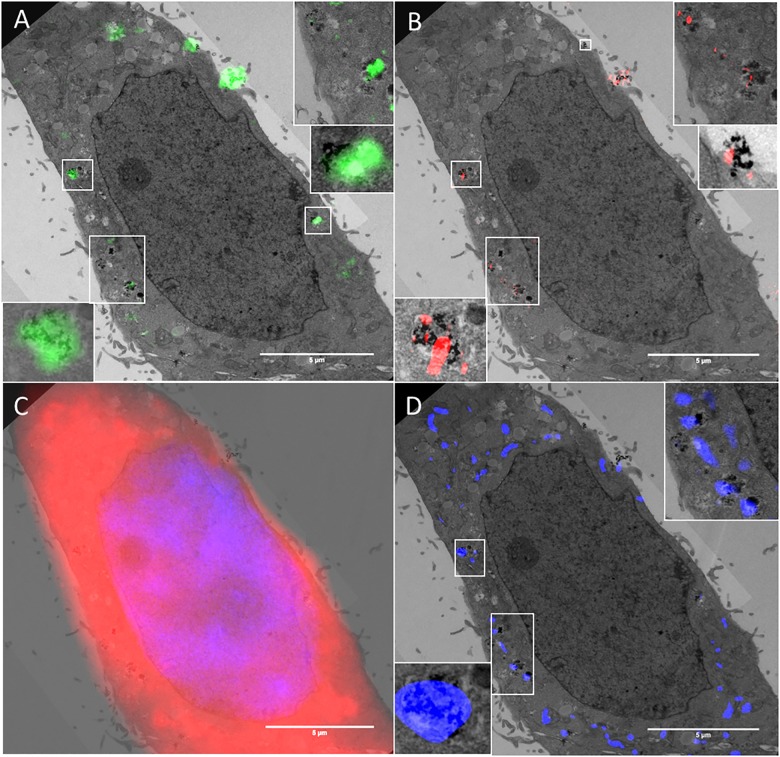
Fig 6. Cellular uptake and localisation of cerium dioxide NPs visualized by RCM, FCM, SIM and TEM.
Reflectance and TEM overlays of HeLa cells treated with cerium dioxide NPs. The ultrastructure of the cell is preserved and the sub-cellular localisation of NPs is evidenced by the lysosomal fluorescence stain (D). The TEM image has a section thickness of 150 nm. RCM overlay has a theoretical optical thickness of ~480 nm. R-SIM has an optical thickness of approximately the measured FWHMaxial which is 685 nm. Adjacent image sections were combined so that the thickness across modalities was as consistent as possible. Reflectance intensity arising in both RCM (A: Green) and SIM (B: Red) corresponds to regions detected by TEM. Overlays of DAPI nuclear and CTDR cytoplasmic stain (C) are shown. LysoTracker DND-99 stain (D: Blue) shows the localisation of detected NPs in lysosomes. White boxes show regions of correlation between all three modalities with increased magnification.

