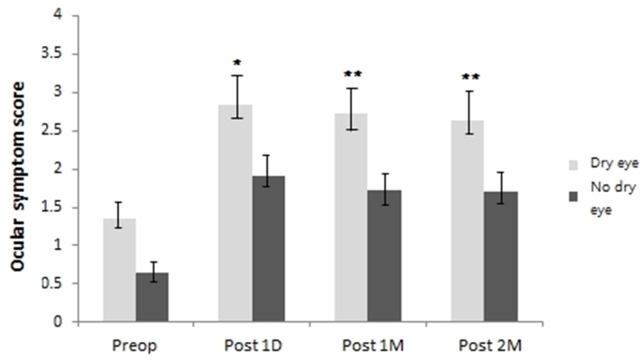
Fig 1. Change in ocular symptom score from preoperative value.
The increase in ocular symptom score was statistically significant in the dry eye group at 1 day, 1 and 2 months postoperatively compared to the no dry eye group (P <0.05). Each value represents the mean ± standard error of the mean (SEM). Significance was evaluated with random-effects analysis of variance (ANOVA) model; p values of <0.05 were considered statistically significant. ***P < .001, **P < .01, *P < .05, using a linear mixed model with post hoc analysis, or generalized estimating equations model.

