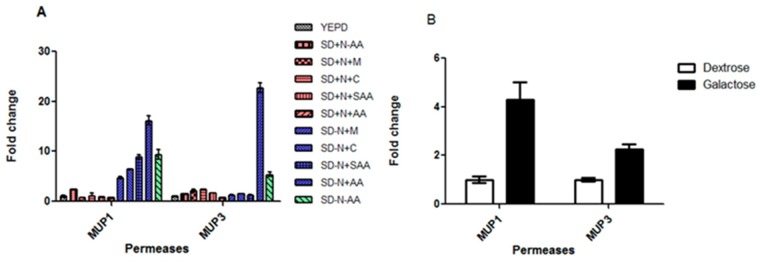
Fig 1. qPCR of the MUP genes in response to nitrogen sources (A) and carbon sources (B), dextrose versus galactose.
In (A) Colors groups represent different nutritional conditions: white = rich medium (YEPD), red = synthetic medium (SD) supplemented with preferred nitrogen source (with ammonium sulfate + selected amino acids), blue = SD (without ammonium sulfate) plus selected amino acids and green = nitrogen starvation. The pattern of the bars represents different medium composition, according to the legend. SD = synthetic dextrose; − or +N = ammonium sulfate omitted or added; − or +C = cysteine omitted or added; − or +M = methionine omitted or added; − or + SAA = cysteine and methionine omitted or added; − or + AA = tryptophan, hystidine and methionine omitted or added, respectively. Statistically significant differences at p value < 0.05.

