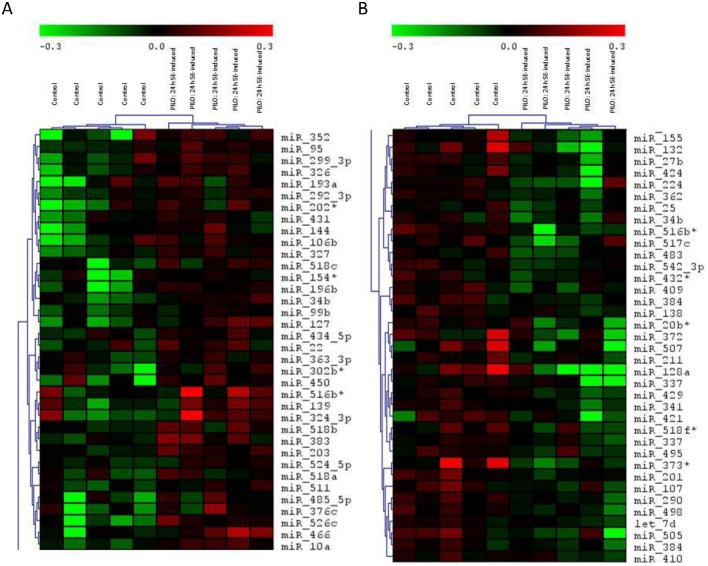
Fig 1. Hierarchical clustering of the 73 miRNA with significantly different expression in 24h post-SE hippocampus versus control experiment.
Rows represent individual genes, and columns represent individual samples. The colorgram depicts high (red), average (black) and low (green) expression levels. A) Upregulated microRNAs. B) Downregulated microRNAs. (n = 5 for both H-PILO and control groups).

