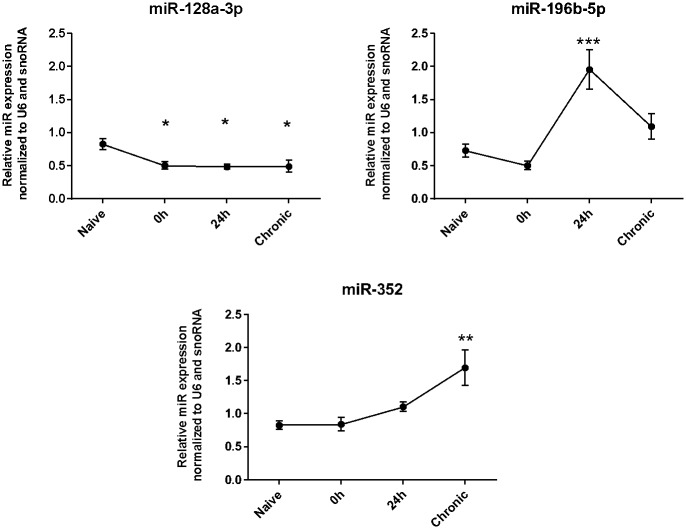
Fig 3. Expression patterns of miR-128a-3p, miR-196b-5p and miR-352 during S-PILO-SE induced epileptogenesis.
RT-qPCR measurements of the relative miRs levels (hippocampus) in three different time points after SE-induction (values are mean±SEM, n = 5-6 in each group, *p < 0.05, Bonferroni’s Multiple Comparison Test.

