
Figure 4.
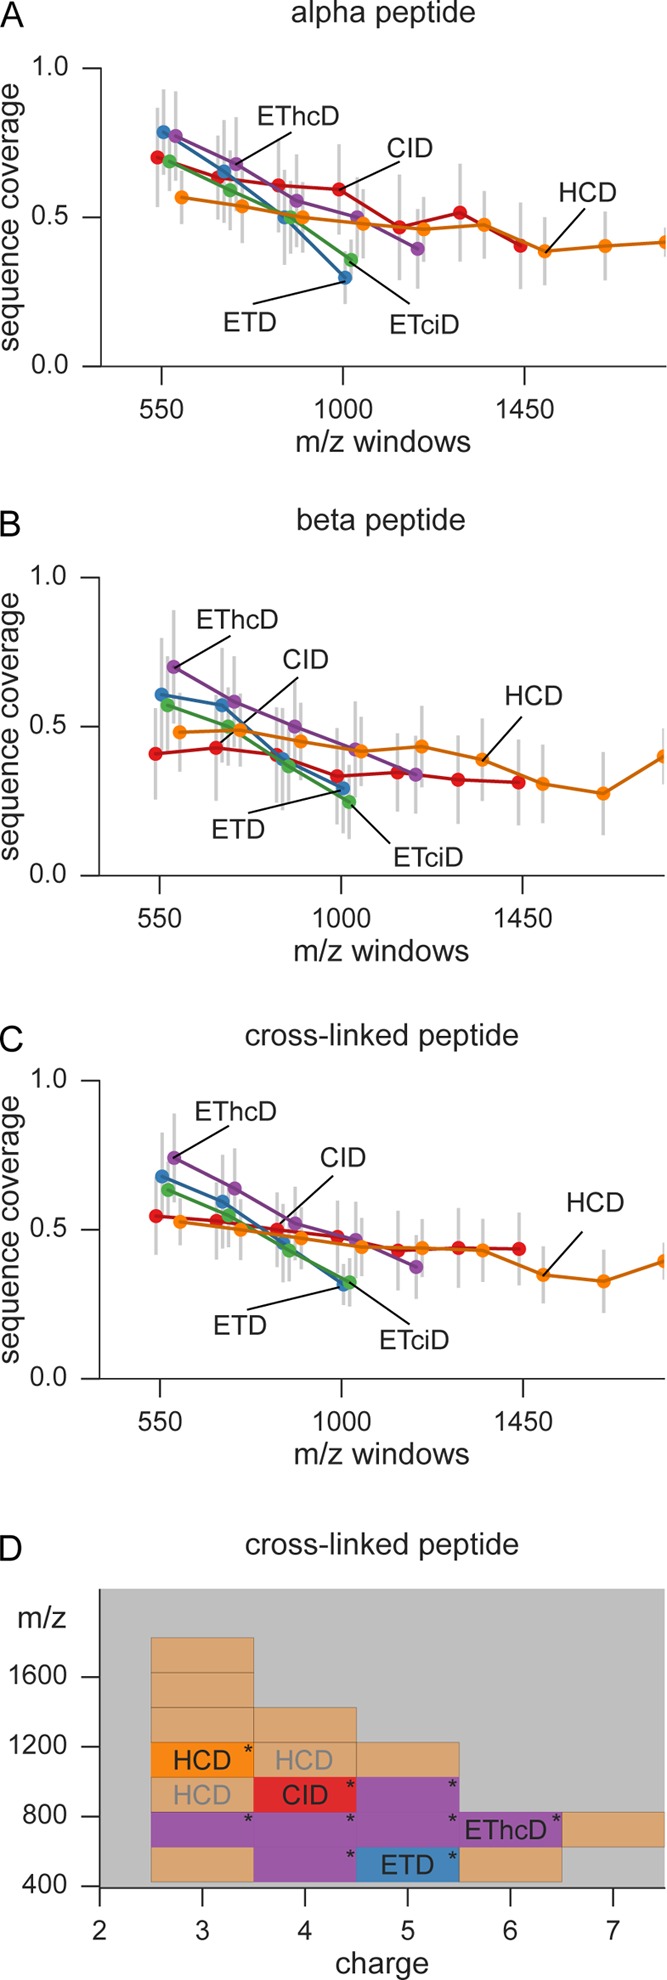
Sequence coverage depending on precursor m/z and charge. The average coverage values from (A) α-peptides, (B) β-peptides, and (C) the complete cross-linked peptide are plotted vs the precursor m/z. Each dot represents the median of all identified peptides in a window of m/z 150. Error bars show the standard deviation. (D) Decision surface to optimize the sequence coverage of cross-linked peptide. The acquisition range was divided into bins of 200 m/z per charge state. In each bin the best performing fragmentation method (judged by median achieved sequence coverage) is used to color that particular bin. The “*” denotes a significant improvement in sequence coverage by using the best performing fragmentation method over the second best. Areas with less than 15 observations are colored in light red, falling back to HCD as standard fragmentation technique. Gray annotations show areas where no significant improvement could be obtained by choosing one method over the others.