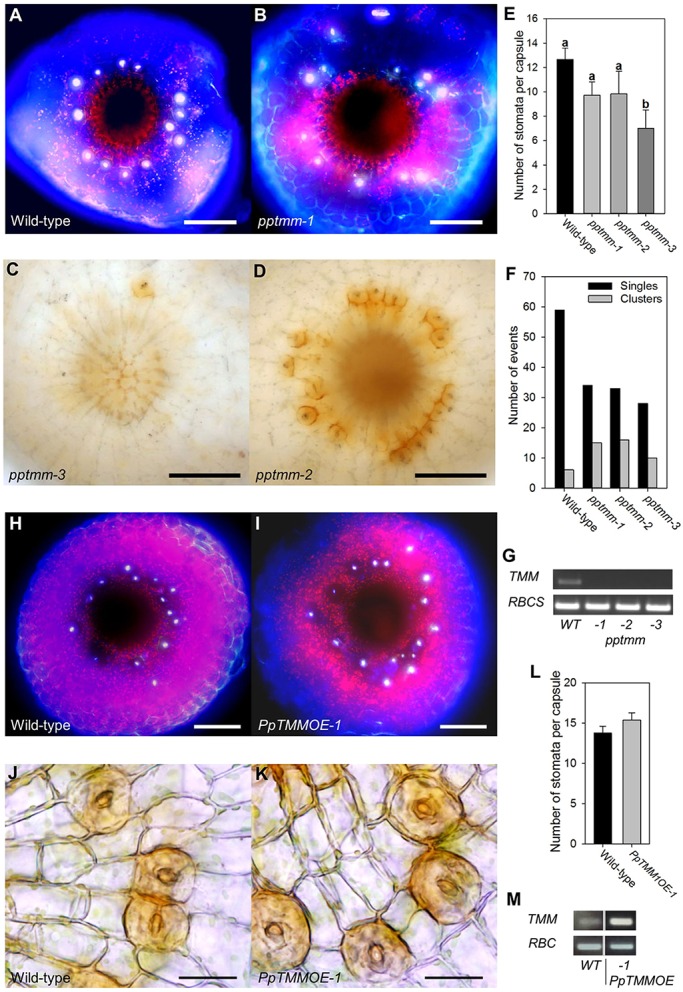
Fig. 3.

TMM functions in stomatal patterning in Physcomitrella patens. (A,B) Fluorescence images of the base of the sporophyte from WT (A) and pptmm-1 (B) plants. The pattern of stomata (bright white fluorescence) is disrupted in the pptmm-1 mutant. (C,D) Bright-field lateral views of the sporophyte base from two transgenic lines: pptmm-3 (C) and pptmm-2 (D). The number and patterning of stomata varies from plant to plant in each of the three independent pptmm lines. (E) Number of stomata per capsule in WT and three pptmm mutant lines. Lines indicated with different letters can be distinguished from each other (P<0.05; one-way ANOVA with multiple comparisons corrected using a Dunnett's test; n>6). (F) Percentage of stomata in clusters in the lines shown in E. (G) RT-PCR analysis of the WT and transgenic lines shown in E with expression of PpTMM (upper panel) and PpRBCS control (lower panel) transcripts. (H,I) Fluorescence images of the base of the sporophyte of WT (H) and PpTMMOE (I) plants. (J,K) Bright-field lateral views of the sporophyte base from WT (J) and PpTMMOE (K) plants. (L) Number of stomata per capsule in WT and PpTMMOE line. No significant difference (P<0.05) was found between the lines (one-way ANOVA with multiple comparisons corrected using a Dunnett's test; n=8). (M) RT-PCR analysis of the WT and transgenic line shown in L with expression of PpTMM (upper panel) and PpRBCS control (lower panel) transcripts. Error bars indicate s.e.m. Scale bars: 100 µm (A,B,H,I); 50 µm (C,D); 25 µm (J,K).
