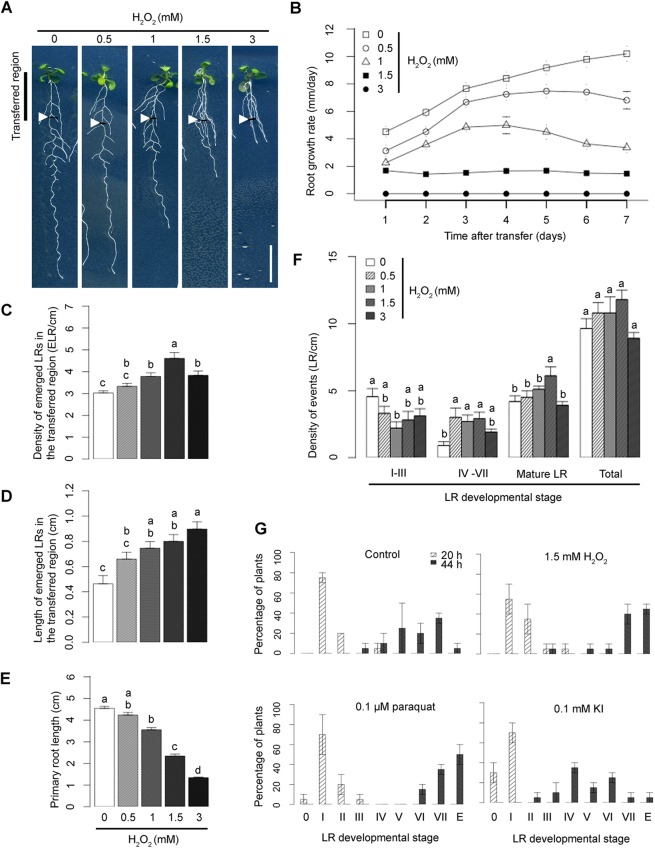
Fig. 1.
The effect of ROS on root development. (A) Morphology of Col-0 grown in control conditions and upon treatment with increasing H2O2 concentrations. Five-day-old seedlings (transferred region) were exposed to H2O2 for 7 days. White arrowheads indicate the root tip region at the moment of transfer. Scale bar: 1 cm. (B) Primary root (PR) growth rates upon treatment with increasing H2O2 concentrations. Five-day-old seedlings were transferred onto media supplemented with increasing concentrations of H2O2. The root tips of the seedlings were marked each day. After 7 days, the distances between each mark were measured and the average root growth for each time point (technical replicates, n=15 per sample) is shown in the graph. (C,D) Average emerged LR density (C) and LR length (D) in transferred region after 7 days of H2O2 treatment (in three biological replicates, n=30). Owing to a strong effect of H2O2 treatment on primary root growth rates, LR density and length were calculated only for the transferred regions of the root. (E) Average PR length after 7 days of H2O2 treatment (in three biological replicates, n=30). (F) Effect of ROS on LRP density after 2 days of different concentrations of H2O2. (C-F) The difference between groups denoted by different lowercase letters is statistically significant (P<0.005 according to Tukey's HSD test after ANOVA). (G) Effect of ROS and ROS scavengers on LR emergence phenotype. Five-day-old seedlings were transferred onto media supplemented with various compounds, as indicated above each graph and gravistimulated by turning the plates 90° to achieve synchronization of LR formation. LRP stages according to Dubrovsky et al. (2006), Himanen et al. (2002), Jansen et al. (2013) and Malamy and Benfey (1997), starting from stage I to an emerged LR (E), are shown on x-axis. Data points represent mean±c.i. (in two biological replicates, n=20).

