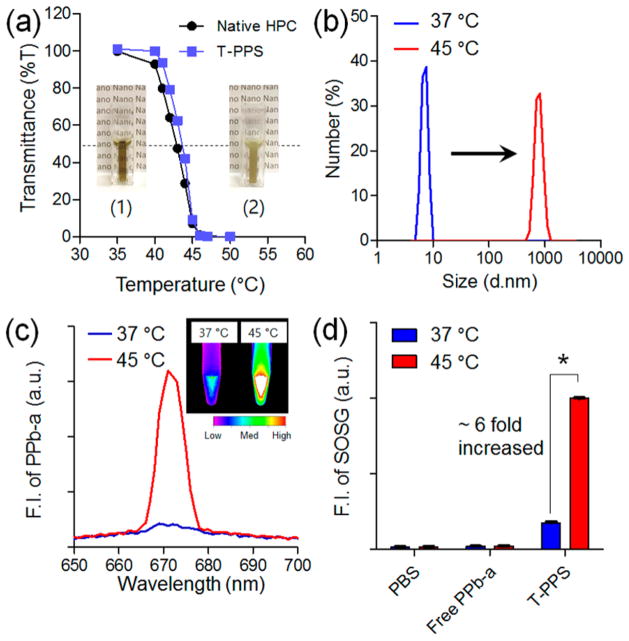
Figure 1.
Physicochemical characterization of T-PPS in different temperature conditions. Temperature-dependent change in (a) transmittance of T-PPS and native HPC (inset: photograph of T-PPS aqueous solution (10 mg/mL in water) at T < LCST and T > LCST), (b) particle size distribution, (c) fluorescent intensity (inset: fluorescent image of T-PPS aqueous solution (10 mg/mL in water) at 37 and 45 °C), and (d) singlet oxygen generation of T-PPS in aqueous solution (n = 3, *p < 0.001).

