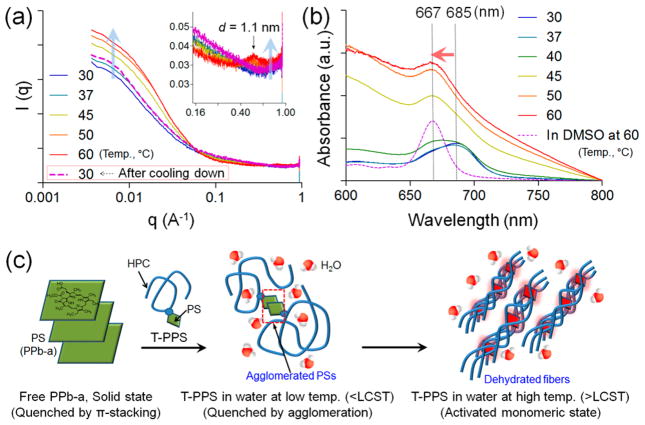
Figure 2.
SAXS analysis of T-PPS at different temperature conditions. (a) SAXS curve for T-PPS in aqueous solution (10 mg/mL) at different temperature (from 30 to 60 °C) and at 30 °C after cooled down. (b) Light absorption spectra for T-PPS in aqueous solution (10 mg/mL) at different temperature (from 30 to 60 °C). (c) Schematic representation for proposed structural transition of T-PPS in different temperature conditions.

