Fig. 1.
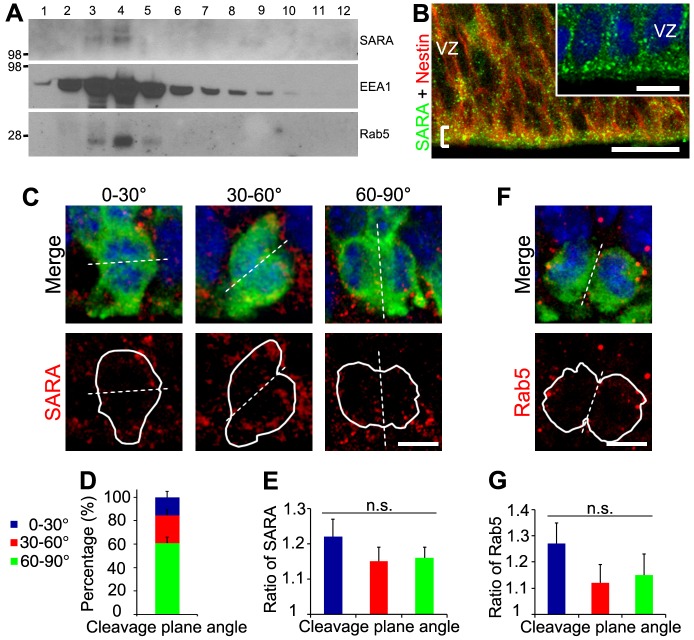
The expression pattern of the EE protein SARA in developing neocortex and its distribution in dividing apical progenitors. (A) E15.5 mouse brains were homogenized and sedimented on a 5-20% linear sucrose gradient. Equal amounts of each fraction were immunoblotted with the indicated antibodies. Marker size (kDa) is indicated on the left. (B) Confocal images of the ventricular surface of E15.5 mouse neocortical slices double labeled for SARA and nestin. A bracket marks the ventricular border. The inset shows a magnified view of SARA labeling. (C) Confocal images of dividing RG of E15.5 cortex expressing GFP (green) and labeled for endogenous SARA (red) classified according to their cleavage plane angle. DAPI is in blue. Dashed line depicts the cleavage plane. White solid lines outline the borders of dividing cell pairs. (D) Percentage of GFP-labeled dividing cells with vertical (60°-90°), intermediate (30°-60°) or horizontal (0°-30°) cleavage plane. Error bars indicate s.e.m. (E) Mean ratios of SARA endosomal distribution between diving cell pairs classified according to their cleavage plane angle. A ratio close to 1 indicates a comparable distribution of SARA between dividing cells. Data are means±s.e.m. P=0.58, one-way ANOVA. n=51 cells from three brains. (F) Representative image of a GFP-expressing dividing pair (green) labeled for endogenous Rab5 (red) at E15.5. DAPI is in blue. (G) Mean ratios of Rab5 endosomal distribution between diving cell pairs classified according to their cleavage plane angle. Data are means±s.e.m. P=0.33, one-way ANOVA. n=21 cells from three brains. Scale bars: 20 µm in B, 10 µm in inset; 5 µm in C,F.

