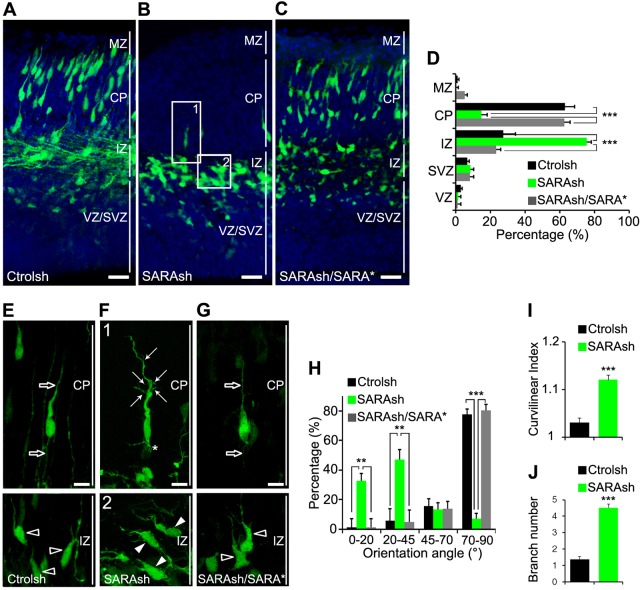
Fig. 3.
SARA is important for neuronal orientation and migration in the developing neocortex. (A-C) Confocal micrographs of cortical slices electroporated at E13.5 with Ctrolsh (A), SARAsh (B) or SARAsh/SARA* (C) plasmids and harvested 3 days later. Blue, DAPI. (D) The percentage of transfected cells in different cortical regions with the indicated plasmids. MZ, marginal zone; CP, cortical plate; IZ, intermediate zone; SVZ, subventricular zone; VZ, ventricular zone. Data are means±s.e.m. n=3 (Ctrolsh, SARAsh/SARA*) or n=4 (SARAsh) brains. ***P<0.0001, one-way ANOVA. (E-G) High-magnification images of Ctrolsh (E), SARAsh (F) and SARAsh/SARA* (G) transfected neurons at the IZ and the CP. Open arrows (E,G) point to the single linear LP and trailing process of a control neuron at the CP. Open arrowheads (E,G) point to IZ-localized control neurons that typically exhibit a pia-directed orientation. (F) High-magnification images of the boxed areas (1 and 2) in B. Arrows and asterisk (F) point to abnormally branched leading and trailing processes, respectively. Arrowheads (F) point to IZ-localized SARAsh-transfected neurons that had both soma and LPs tilted from the pia-directed (vertical) angle. (H) Percentage of neurons expressing either Ctrolsh (n=3 brains), SARAsh (n=4 brains) or SARAsh/SARA* (n=3 brains) classified according to their orientation angle; taking the ventricular border as the horizontal plane with an angle of 0°. For this quantification, only bipolar neurons with a clear LP, which is morphologically distinct from other minor processes observed in multipolar neurons, were considered. Over 300 cells were counted from at least three brains. Data are means±s.e.m. **P<0.01, ***P<0.0001, one-way ANOVA. (I,J) Quantification of the curvilinear index (I) and branch number (J) for the LPs of neurons transfected with the indicated plasmids. Data are means±s.e.m. ***P<0.001, t-test. Scale bars: 50 µm in A-C; 10 µm in E-G.

