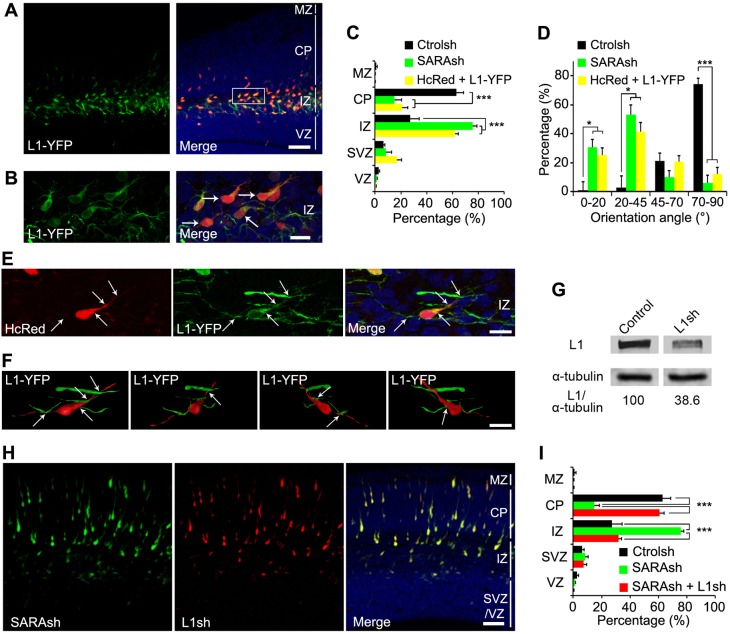
Fig. 5.
Functional interaction between L1 and SARA during cortical migration. (A,B) Cortical slices co-transfected with HcRed and L1-YFP at E13.5 and harvested 3 days later; L1-YFP was visualized by GFP immunolabeling. Higher magnification image of the boxed area in A is shown in B. Arrows point to L1-YFP-transfected neurons stalled at the IZ with a tilted orientation. (C) Quantification of transfected cell distribution in different cortical regions. Data are means±s.e.m. n=3 (Ctrolsh), n=4 (SARAsh) or n=6 (HcRed+L1-YFP) brains. ***P<0.0001, one-way ANOVA. (D) The orientation angles of IZ- and CP-localized neurons expressing the indicated plasmids were scored by considering the ventricular border as 0°. Over 300 cells were counted from at least three brains. Data are means±s.e.m. *P<0.05, ***P<0.0001, one-way ANOVA. (E) Enlarged view of an L1-YFP/HcRed-coexpressing neuron at the IZ. Note the multiple contacts with neuronal processes from neighboring cells (arrows). Notably, L1-YFP better labeled the thin processes than did HcRed. These images were rendered into a 3D reconstruction as shown in the first panel of F. (F) Four 3D views of the IZ-localized L1-YFP-transfected neuron (as in E) are shown. For simplicity, only one soma is shown; the somata of neighboring transfected cells were masked. Also see Movie 1, in which all transfected cells are shown. The cell body and its cell processes are pseudocolored in red for a better visualization of cell-neurite and neurite-neurite contact sites (arrows). (G) Validation of L1 KD by L1sh. HEK cells were co-transfected with L1-YFP and mCherry (control) or L1sh/mCherry for 36 h and cell lysates processed for immunoblotting with the indicated antibodies. The signal ratio of L1 to α-tubulin of the control is considered as 100. (H) An example of a brain slice co-transfected with SARAsh and L1sh at E13.5 and harvested 3 days later. (I) The percentage of cells transfected with Ctrolsh, SARAsh or SARAsh together with L1sh that distributed into different cortical regions. Data are means±s.e.m. n=3 (Ctrolsh), n=4 (SARAsh, SARAsh+L1sh) brains. ***P<0.0001, one-way ANOVA. Note that the quantifications of Ctrolsh- and SARAsh-transfected brains correspond to those shown in Fig. 3 and are displayed here for comparison. Scale bars: 50 µm in A,H; 12 µm in B; 10 µm in E,F.

