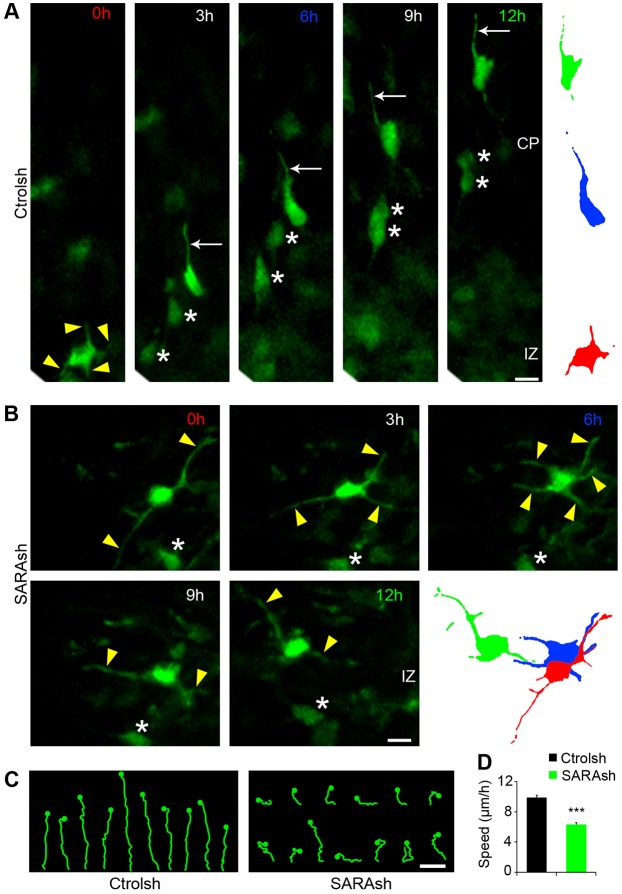
Fig. 6.
SARA KD cells exhibit impaired multipolar-to-bipolar transition. (A,B) Representative still images from time-lapse recordings tracking electroporated neurons for 12 h. Brains were electroporated with Ctrolsh or SARAsh at E13.5 and processed for slice cultures at E15.5. By the time the imaging experiment started, most neurons had already localized to the SVZ/IZ. Migration trajectories and speed were evaluated from this brain area on. Arrowheads point to neuronal processes of a multipolar neuron. Arrows point to the LP of a control migrating neuron. Asterisks label the soma of other transfected neurons in the same field of view. To the right, traces represent migrating neurons at 0 h (red), 6 h (blue) and 12 h (green). In A, a multipolar (t=0 h) Ctrolsh-transfected neuron acquires a bipolar morphology and migrates into the CP. In B, a SARAsh-transfected neuron displays a multipolar morphology with various processes actively extending and retracting throughout the imaging period. (C) Examples of neuron trajectories for the indicated plasmids. The dots indicate the final soma position at the end of the time-lapse experiment (t=12 h). (D) Quantification of migration speed for Ctrolsh- and SARAsh-transfected neurons. Data are means±s.e.m. ***P<0.0001, t-test. At least 64 neurons were scored for each condition. Scale bars: 10 µm.

