
Fig. 7.
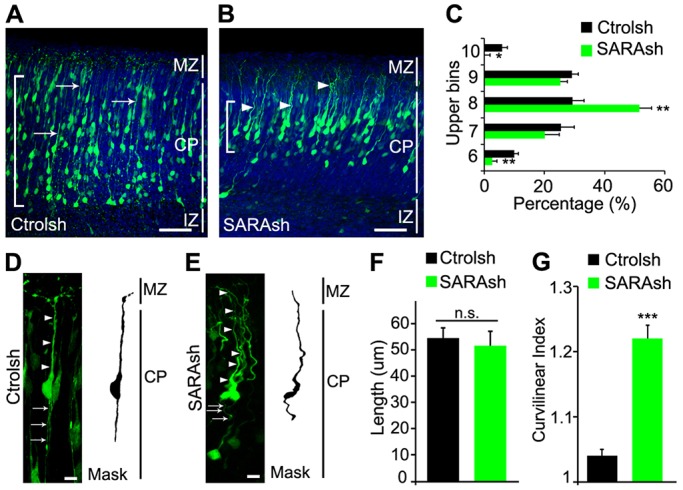
SARA KD cells arrive late at the CP and exhibit aberrant LPs. (A-C) Mouse cortices electroporated at E13.5 with Ctrolsh (A) or SARAsh (B) plasmid and harvested 5 days later. Control neurons have straight, linear LPs (arrows), whereas SARAsh-transfected neurons tend to be nonlinear and undulating (arrowheads). Brackets (A,B) show the cortex area where most transfected cell bodies locate. Cortices were divided into ten equally sized bins and the percentage of cells in each bin was scored; only the upper bins (6-10) contained transfected cells, and their percentages are shown in C. Data are means±s.e.m. n=3 brains for each condition. *P<0.05, **P<0.001, one-way ANOVA. (D,E) High-magnification images of 5-day transfected neurons. Arrowheads and arrows point to LPs and trailing processes, respectively. (F) Quantification of LP length of neurons transfected with the indicated plasmids. Data are means±s.e.m. P=0.62, t-test. (G) Quantification of curvilinear index for the LP of neurons transfected with the indicated plasmids. Data are means±s.e.m. ***P<0.0001, t-test. At least 19 neurons from three brains were scored for each condition. Scale bars: 50 µm in A,B; 10 µm in D,E.