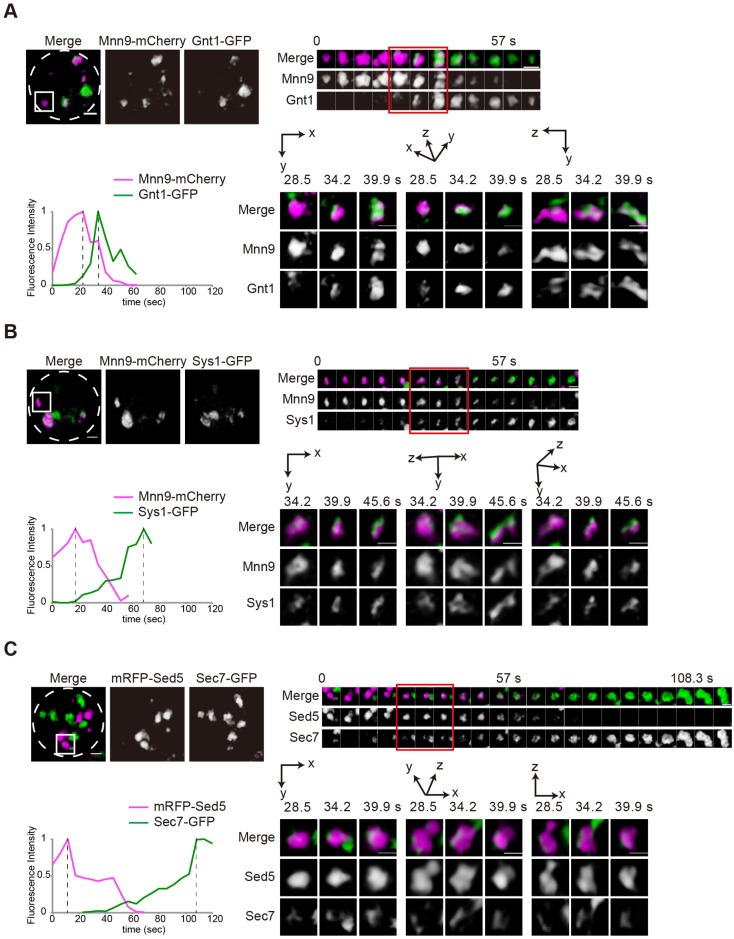
Fig. 2.
4D observation of cisternal maturation. Wild-type cells expressing (A) Mnn9–mCherry (cis, magenta) and Gnt1–GFP (medial, green), (B) Mnn9–mCherry (cis, magenta) and Sys1–GFP (trans, green) and (C) mRFP–Sed5 (cis, magenta) and Sec7–GFP (trans, green) were grown to a mid-logarithmic phase in synthetic medium at 30°C and observed by SCLIM. Upper left panels show representative 3D images. Dashed lines indicate the edge of the cells. Upper right montages show 3D time-lapse images (4D) of the indicated squares. Lower left panels show the relative fluorescence intensities of green and red channels in the indicated cisterna. Lower right panels show magnified images of cells at selected time points. Scale bars: 1 µm. Representative images from at least 26 independent cisternae are shown.

