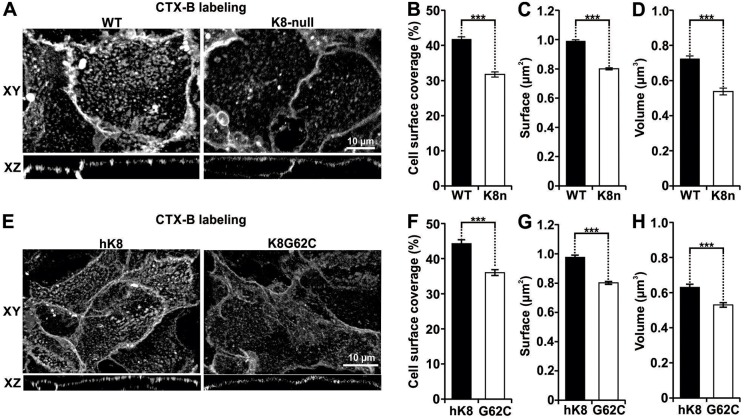
Fig. 1.
K8/K18 IF modulation of three interrelated size parameters of CT-lipid rafts in hepatocytes. (A) Lateral (XY) and axial (XZ) fluorescence images of WT and K8-null hepatocyte lipid rafts labeled using Vybrant® Alexa Fluor® 488 (CTX-B labeling), showing that the lipid raft distribution is perturbed as result of the K8/K18 IF loss. (B) Percentage cell surface coverage by lipid rafts on WT and K8-null (K8n) hepatocytes, showing a decrease as result of the K8/K18 IF loss (n>74). (C) Surfaces of coalesced CT-lipid rafts on WT and K8-null (K8n) hepatocytes showing a reduction as result of the K8/K18 IF loss (n>74). (D) Volumes of coalesced CT-lipid rafts on WT and K8-null (K8n) hepatocytes showing a decrease as result of the K8/K18 IF loss (n>70). (E) Lateral (XY) and axial (XZ) fluorescence images of hK8 and K8G62C hepatocyte lipid rafts labeled using Vybrant® Alexa Fluor® 488 (CTX-B labeling), showing that the G62C mutation perturbs the lipid raft organization. (F) Percentage cell surface coverage by lipid rafts on hK8 and K8 G62C (G62C) hepatocytes, showing a decrease as result of the G62C mutation (n>40). (G) Surfaces of coalesced CT-lipid rafts on hK8 and K8 G62C (G62C) hepatocytes, showing a decrease as result of the G62C mutation (n>40). (H) Volumes of coalesced CT-lipid rafts on hK8 and K8 G62C (G62C) hepatocytes, showing a decrease as result of the G62C mutation (n>40). Quantitative results are mean±s.e.m. ***P<0.005 (t-test).

