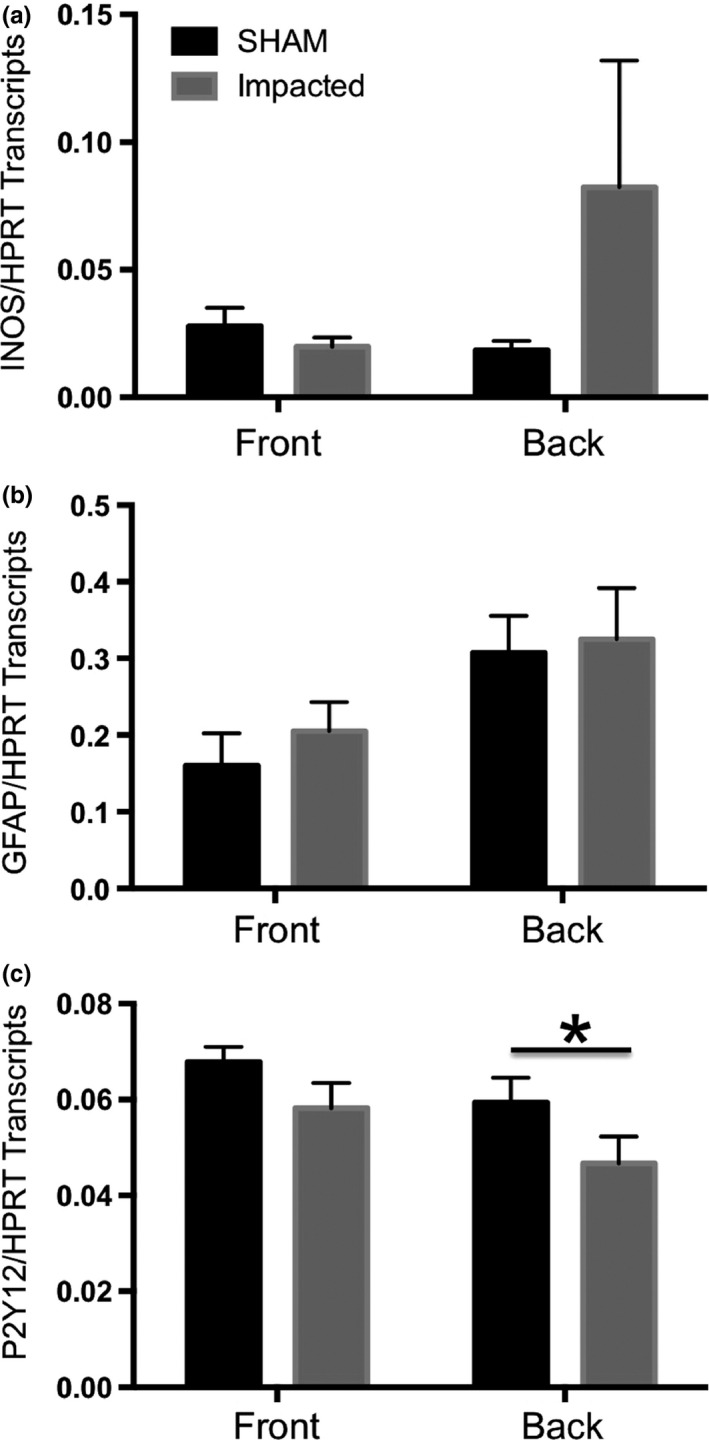
Figure 3.

Standard curve based qPCR analysis of glial activation in the impacted cortex 24 h post‐treatment. Right cortices of treated mice were divided into two portions: the front, corresponding to the cortical regions rostral to the site of impact (corresponding to MRI sections 1–3 detailed in Fig. 1) and the back, encompassing the site of impact (corresponding to MRI sections 4–6 detailed in Fig. 1) The levels of inducible nitric oxide (iNOS) (Panel a), glial fibrillary acidic protein (GFAP) (Panel b) and P2Y12 (Panel c) transcripts were quantified in the right front cortices and the right back cortices from sham treated (black bars) and mild closed head injury (mCHI)‐treated mice (grey bars). A significant decrease in P2Y12 transcripts was detected in comparisons of transcript levels in the impact zone (back region) of cortices from mCHI versus sham‐treated mice (Student t‐test, *p < 0.05, n = 5 per treatment).
