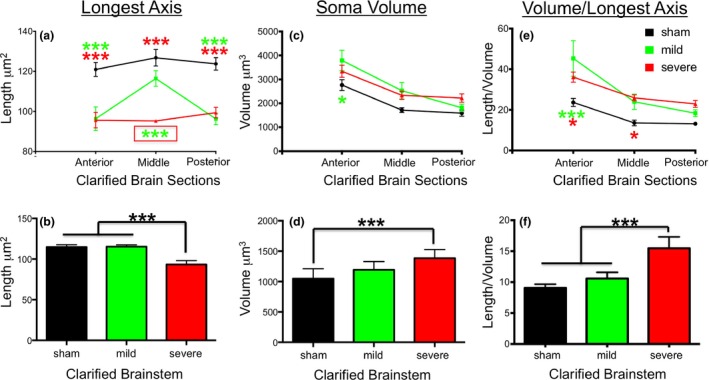
Figure 7.

Quantification of microglia morphology by length of longest axis (a), soma volume (b) and the ratio of soma volume/longest axis (c) in clarified brain sections (anterior‐middle‐posterior) and in the brainstem (panels d–f). Sham treatment = black lines and bars; mCHI = green lines and bars; sCHI = red lines and bars. In panels (a–c), green and red stars indicate statistical difference of mild and severe CHI from sham treated mice. Boxed green stars in panel (a) indicate statistical difference of sCHI from both mCHI and sham treated mice. For all panels, three stars designates p < 0.001, one star designates p < 0.05 as analyzed by anova.
