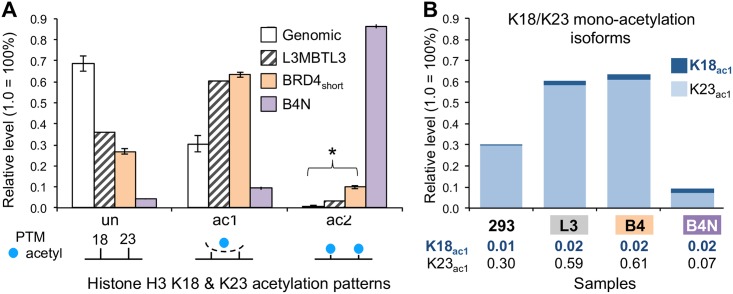
Fig 2. Quantification of H3 K18 and K23 acetylation enrichment.
(A) Relative levels of unmodified, mono-acetylation, and di-acetylation of the H3 peptide spanning K18 and K23 in genomic and immunoprecipitated histones. Note that the mono-acetylation values combine K18ac1K23un and K18unK23ac1 together. Error bars of genomic and BRD4short samples represent standard deviation of 4 replicates. Error bars of B4N sample represent range of 2 replicates. Asterisk denotes significant difference in ac2 levels between input and BRD4short (p < 0.05). (B) Resolving the mono-acetylation patterns in Fig 2A into the two isoforms for each sample. Relative levels are provided below each bar corresponding to K18ac1 (top bold) and K23ac1 (bottom) and are the same scale as in panel A. For instance, the 30% H3K23ac1 in the genomic sample is relative to unmodified, H3K18ac1, and H3K18K23ac2 as seen in Panel A. Note that most of the mono-acetylated in the samples is K23ac1. 293 refers to genomic histones, L3 refers to L3MBTL3 associated histones, and B4 refers to BRD4short associated histones.

