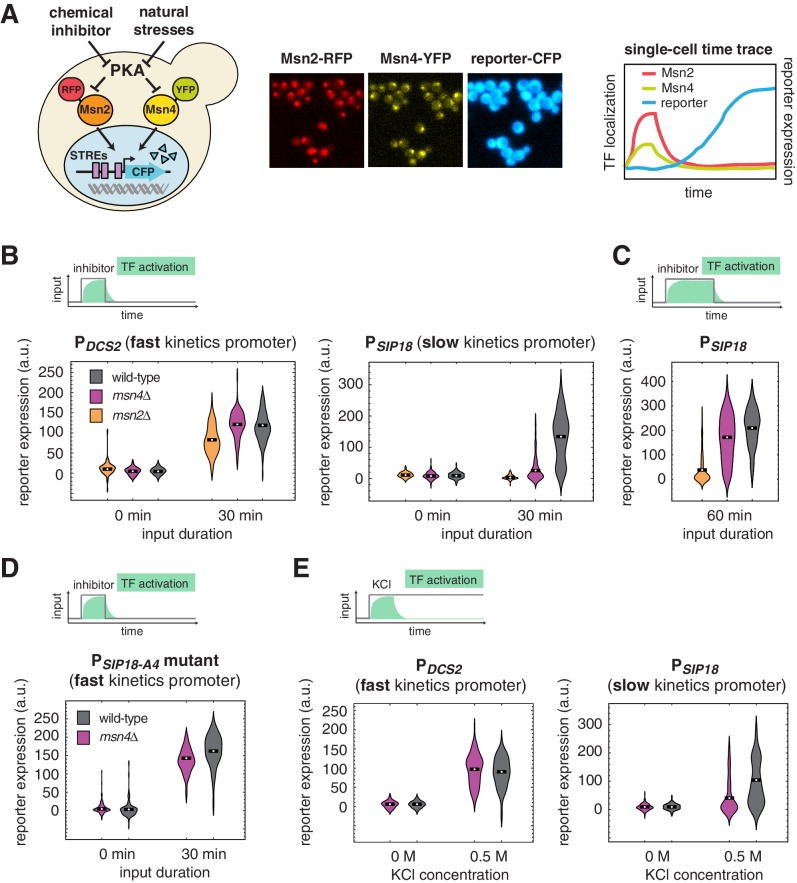
Figure 1. Msn4 is required for the induction of target genes with slow promoter kinetics.
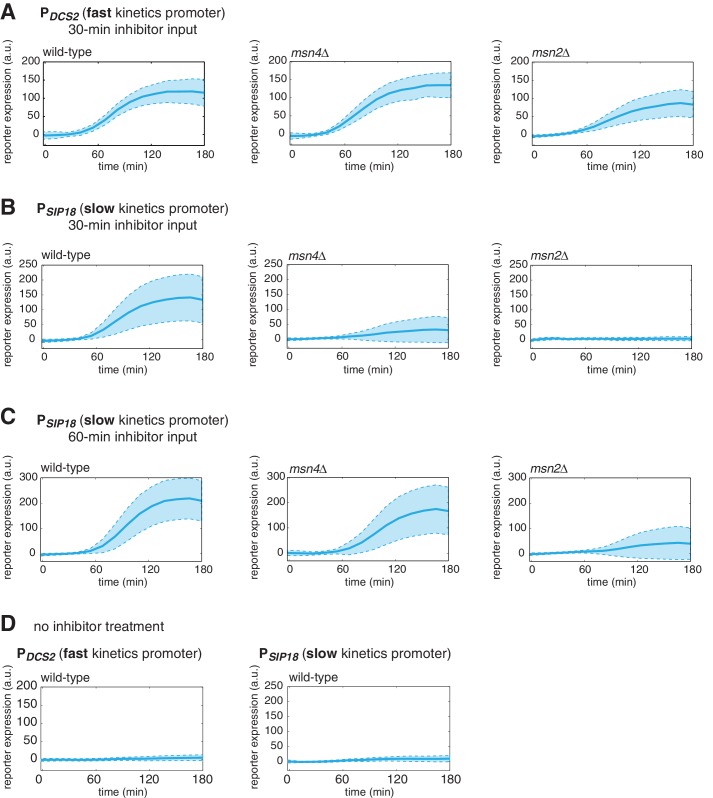
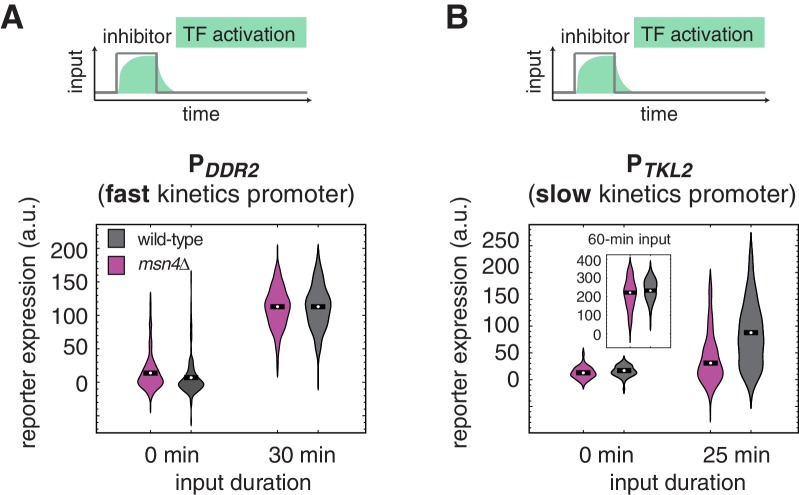
(A) Homologous TFs Msn2 and Msn4 are regulated by the same upstream PKA signals in response to natural stresses or chemical inhibitors and control a common set of target genes with stress response elements (STREs) in their promoters. In the same strain, Msn2 and Msn4 are fused with RFP and YFP respectively, at their native loci; a CFP reporter under the Msn2/4 specific promoter is introduced to monitor gene expression responses. Middle: Translocation of Msn2-RFP and Msn4-YFP and reporter gene expression can be monitored in the same single cells over time. Right: In response to stimulation, time traces of Msn2 and Msn4 translocation and reporter gene expression can be quantified for each single cell. For each condition, single-cell data are collected from at least three independent experiments. (B) Violin plots showing the distributions of reporter expression under (left) the fast kinetics promoter PDCS2 or (right) the slow kinetics promoter PSIP18 in single cells in response to 3 μM inhibitor inputs with 30-min pulse duration (illustrated by the top inset) in wild-type, msn2Δ, and msn4Δ strains, respectively (n: ~300 cells per condition per strain). The mean value of single cell responses was labeled using the black bar for each condition. The expression of the reporter gene was tracked in single cells over a 3-hr period in which the reporter fluorescence in most cells has already reached the plateau. The last point of each single-cell time trace was used in the plots (a.u.: arbitrary units). (C) Violin plots showing the distributions of reporter expression under the slow kinetics promoter PSIP18 in response to a 60 min pulse of inhibitor input. (D) Violin plots showing the distributions of reporter expression under the faster mutant promoter PSIP18-A4 in wild-type and msn4Δ strains, respectively, in response to 30-min inhibitor input. (E) Violin plots showing the distributions of reporter expression under (left) the fast kinetics promoter PDCS2 or (right) the slow kinetics promoter PSIP18 in response to 0.5 M KCl in wild-type and msn4Δ strains, respectively. The sustained KCl stimulation leads to a transient pulse of TF activation, as illustrated in the top cartoon panel.


