. 2016 Sep 30;5:e18458. doi: 10.7554/eLife.18458

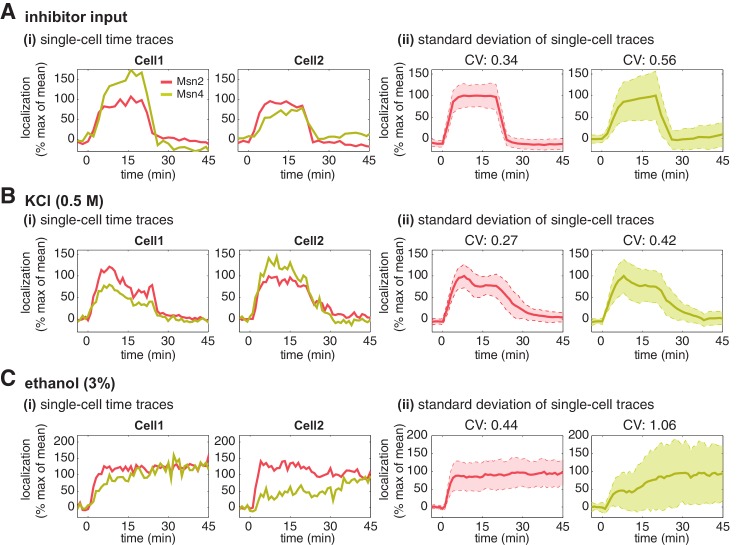
Figure 2. Msn2 and Msn4 show different levels of heterogeneity in single cells.

Time traces of Msn2 and Msn4 nuclear translocation in the same single cells in response to (A) 20-min 1 μM inhibitor pulse, (B) 0.5M KCl, or (C) 3% ethanol. In each panel, (i) representative single-cell time traces of Msn2 and Msn4 nuclear translocation in the same single cells; (ii) standard deviation of single-cell time traces. For each condition, the single-cell time traces and standard deviations of single cell responses are scaled by the peak value of the averaged time traces (% max of mean). In (ii), the solid curve represents the averaged time trace; the shaded region represents the scaled standard deviation of single cell responses. The coefficient of variation (CV; the standard deviation divided by the mean) is calculated for the peak time point of time traces for each condition and displayed above each time trace.

DOI: http://dx.doi.org/10.7554/eLife.18458.006

Figure 2.

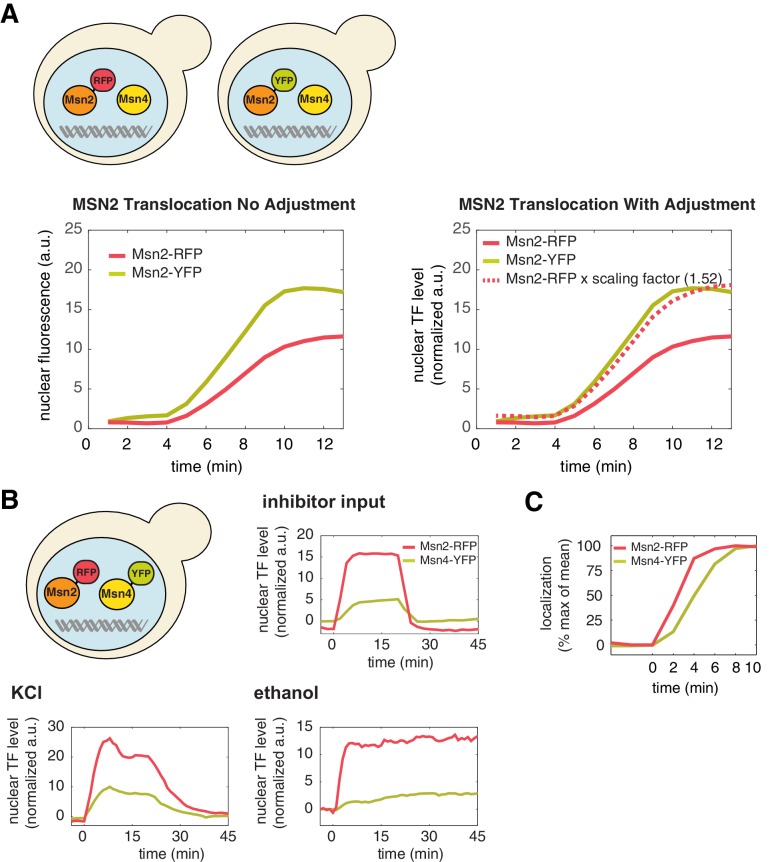
Figure 2—figure supplement 1. A direct comparison of the levels of Msn2 and Msn4 nuclear localization in the same cells.

Figure 2—figure supplement 1.

(A) To directly compare the nuclear level of Msn2-RFP relative to that of Msn4-YFP in the same single cells (Figure 1A), a scaling factor between RFP and YFP is needed to account for unique microscope settings used in each channel as well as inherent emission differences between each fluorophore. This was determined by creating two yeast strains in which Msn2 was C-terminally tagged with either florescent protein RFP or YFP, respectively (illustrated in the top panel). Left: Sustained nuclear translocation of Msn2 was induced in both stains with an identical stimulus and the averaged single-cell time traces of Msn2 translocation were generated for both strains (n: ~100 cells per strain). Right: The scaling factor (1.52) was determined by taking the ratio between the maximal fluorescence intensity of each averaged trace. The time trace of Msn2-RFP, when times the scaling factor (dashed curve), overlaps with the time trace of Msn2-YFP. Therefore, this factor normalizes the fluorescence arbitrary unit of RFP with the fluorescence arbitrary unit of YFP and enables the direct comparison of the nuclear level of Msn2-RFP with that of Msn4-YFP in the same single cells (in the unit of 'normalized a.u.'). (B) Averaged time traces of Msn2 and Msn4 nuclear translocation in the same single cells in response to 20-min 1 μM inhibitor pulse, 0.5M KCl, or 3% ethanol, as indicated. The top left panel illustrates that Msn2-YFP and Msn4-RFP are expressed in the same strain. The averaged traces were normalized by the scaling factor to allow a direct comparison of Msn2 and Msn4 in the same cells. (C) Averaged time traces of Msn2 and Msn4 nuclear translocation from the same cells were normalized as% of max. The traces were plotted together and zoomed in to the early time period of the response to demonstrate the small time delay of Msn4 translocation.
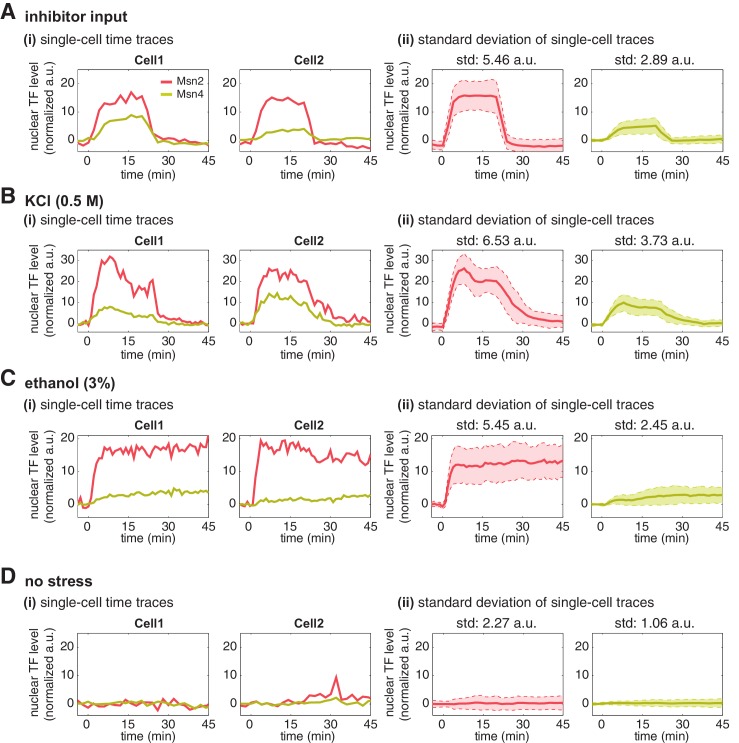
Figure 2—figure supplement 2. Single-cell time traces of Msn2 and Msn4 after normalization of YFP and RFP fluorescence.

Figure 2—figure supplement 2.

After the YFP and RFP normalization as shown in Figure 2—figure supplement 1, time traces of Msn2 and Msn4 nuclear translocation are plotted in the same single cells in response to (A) 20-min 1 μM inhibitor pulse, (B) 0.5M KCl, (C) 3% ethanol, or (D) no stress. Each panel shows (i) representative single-cell time traces of Msn2 and Msn4 nuclear translocation in the same single cells; (ii) standard deviation of single-cell time traces. For each condition, the single-cell time traces and standard deviations of single cell responses are normalized so that the levels of Msn2 and Msn4 can be compared directly. In (ii), the solid curve represents the averaged time trace; the shaded region represents the standard deviation of single cell responses. The standard deviation is calculated for the peak time point of time traces for each condition and displayed above each time trace. For the condition without stress, the standard deviation is calculated for the time point used in the inhibitor condition.