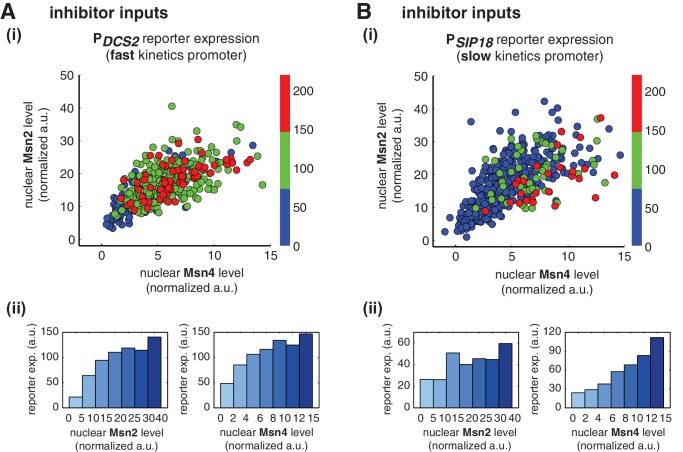
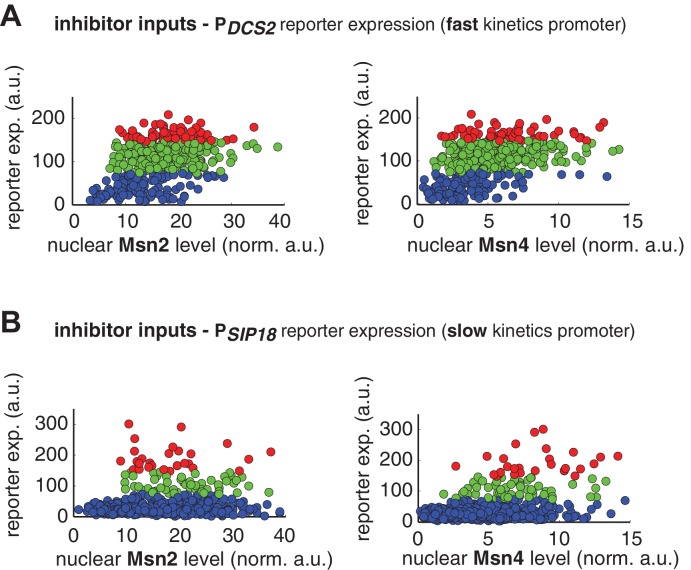
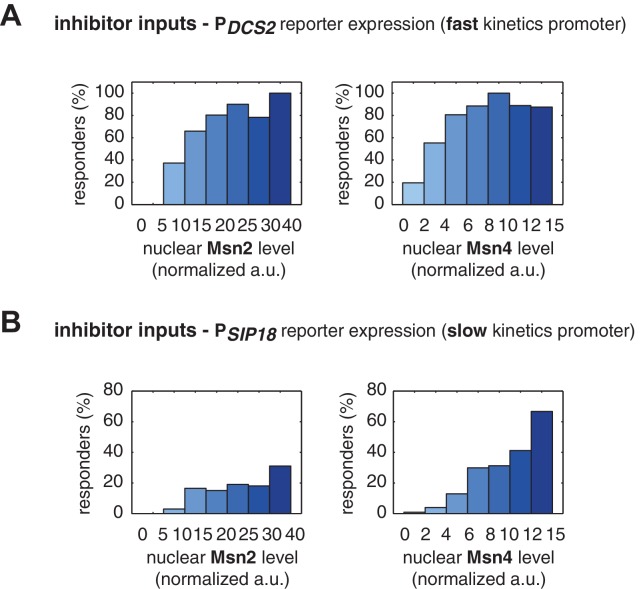
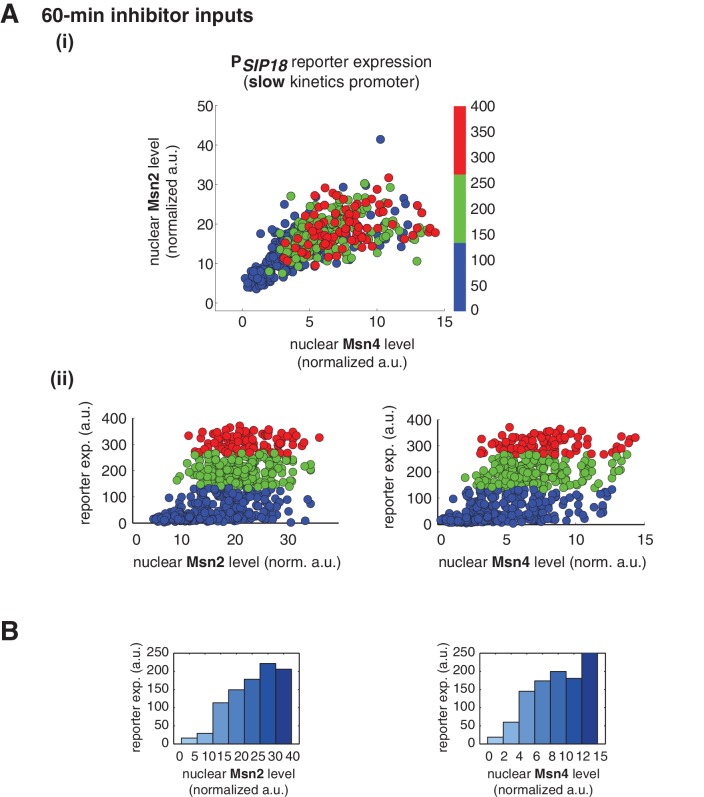
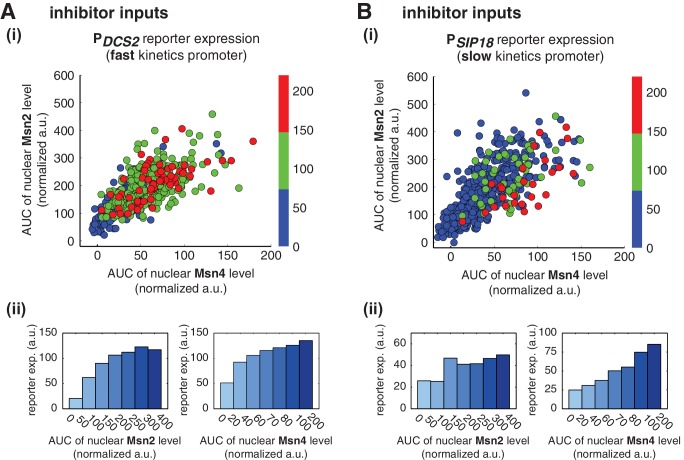
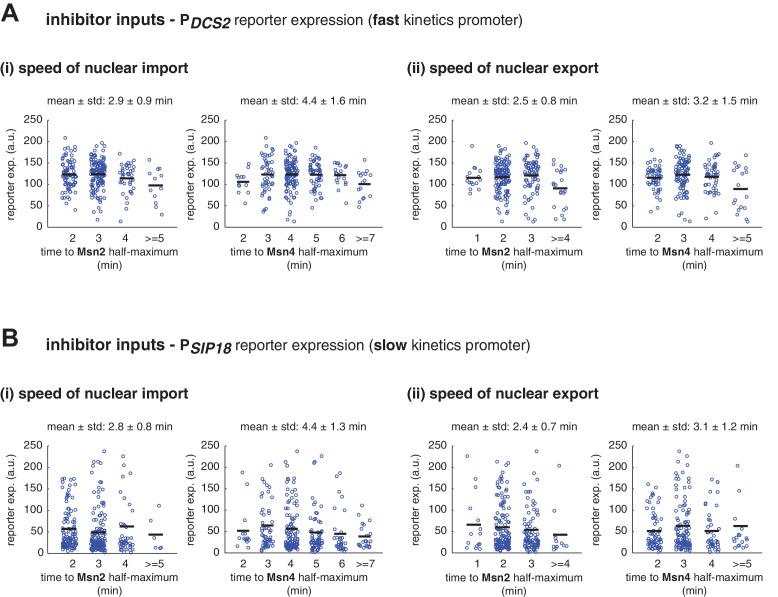
Figure 3. Msn2 and Msn4 exhibit distinct gene regulatory functions in single cells in response to 30-min inhibitor inputs.
(A) (i) A scatter plot showing the relationship of the fast kinetics promoter PDCS2 reporter expression with Msn2 and Msn4 activation at the single cell level. Each dot represents a single cell. Single-cell time traces were tracked over a 3-hr period in which the reporter fluorescence in most cells has already reached the plateau. The x and y axes represent the peak values of Msn4 and Msn2 nuclear translocation (the maximal values in the first 30 min of translocation time traces), respectively; and the dot color represents the maximal level of gene expression as indicated in the color bar. To cover the full dynamic range of TF translocation, the data from the experiments using 30 min inhibitor pulses with 0.1, 0.25, 0.5, 0.75 and 1 μM doses have been combined (n: 444 cells). (ii) Plots show the relationships between PDCS2 reporter expression and (left) Msn2 or (right) Msn4, respectively. Single cells are binned based on their Msn2 or Msn4 nuclear level as indicated in the x-axis and the average of reporter expression is calculated for each binned groups of single cells and shown in the bar graphs. (B) Scatter plots and bar graphs showing the relationship of the slow kinetics promoter PSIP18 reporter expression with Msn2 and Msn4 activation at the single cell level. The data analysis and presentation schemes are consistent with those in (A) (n: 595 cells). Single-cell data used in these plots are provided in the source data files.
DOI: http://dx.doi.org/10.7554/eLife.18458.009

