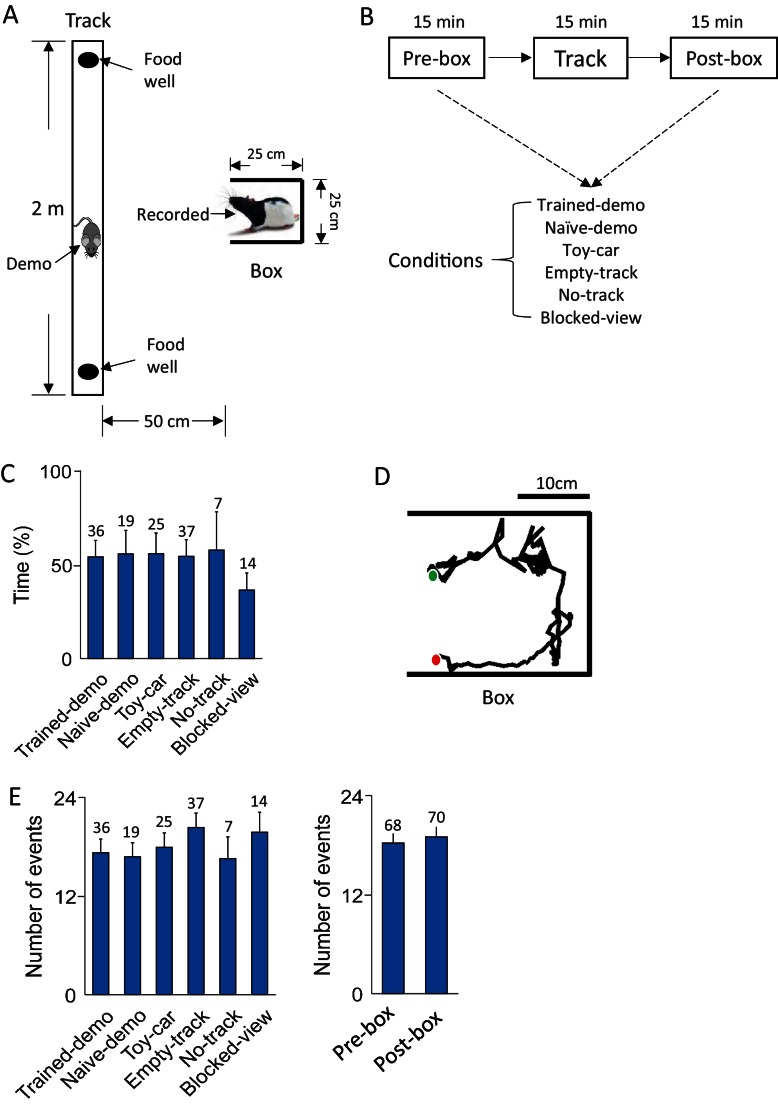
Figure 1. Behavioral tasks.
(A) A recorded rat staying in a small box while a demonstrator (Demo) running on a nearby linear track. (B) Daily experimental procedure: staying in the box before (Pre-box) and after (Post-box) running the track (Track). The Pre- and Post-box sessions were configured with various conditions (see Results). A shows the condition with a demo (Trained-demo or Naïve-demo). (C) Average percentage of time animals spent facing the opening side of the box under each box condition (F(5,133) = 12, p=6.5 × 10⁻¹⁰, comparing among all conditions one-way ANOVA; F(4,119) = 1.4, p=0.23, comparing among the conditions other than Blocked-view). Number on top of each bar: number of sessions. (D) Animal’s head trajectory in an example rotation event in the box. Green/red dots: start/end positions, respectively. (E) Average number of rotation events per session under each box condition (F(5,133) = 1.6, p=0.17, one-way ANOVA) and in Pre-box and Post-box sessions (t = 0.46, p=0.65, t-test). Number on top of each bar: number of sessions.


