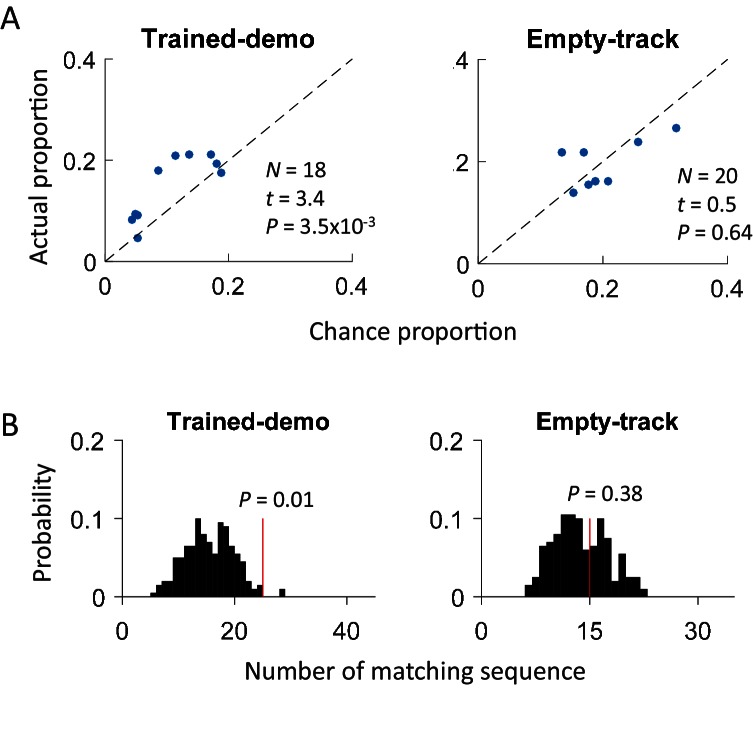
Figure 5. Cross-activation of CA1 activities appeared in Pre-box prior to the first self-running experience on the track.
(A) Scatter plot of actual proportion versus chance proportion of common cells for Pre-box sessions under Trained-demo and Empty-track before the very first self-running on the track. Each dot represents a pairing between a Pre-box session and one of the two track trajectories on the same day. Dashed line: line of equal actual and chance proportion values. N: number of pairings between Pre-box sessions and track trajectories; t, P: paired t-test statistics and p value between actual and chance proportions. (B) Actual number of matching sequences (red line) relative to the distribution of randomly-generated number of matches (black histogram) in Pre-box under Trained-demo and Empty-track before first self-running on the track. P: significance p-values.

