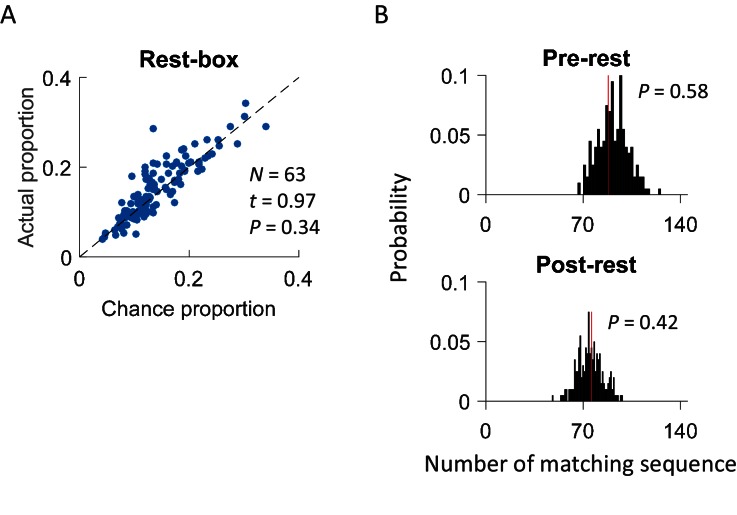
Figure 6. Cross-activation of CA1 activities did not occur in a rest box.
(A) Scatter plot of actual proportion versus chance proportion of common cells for each rest session. Each dot represents a pairing between a rest session with one of the two track trajectories on the same day. Dashed line: line of equal actual and chance proportion values. N: number of pairings between rest sessions and track trajectories; t, P: paired t-test statistics and p value between actual and chance proportions. (B) Actual number of matching sequences (red line) relative to the distribution of randomly-generated number of matches (black histogram) in rotation events in the rest box. P: significance p-values.

