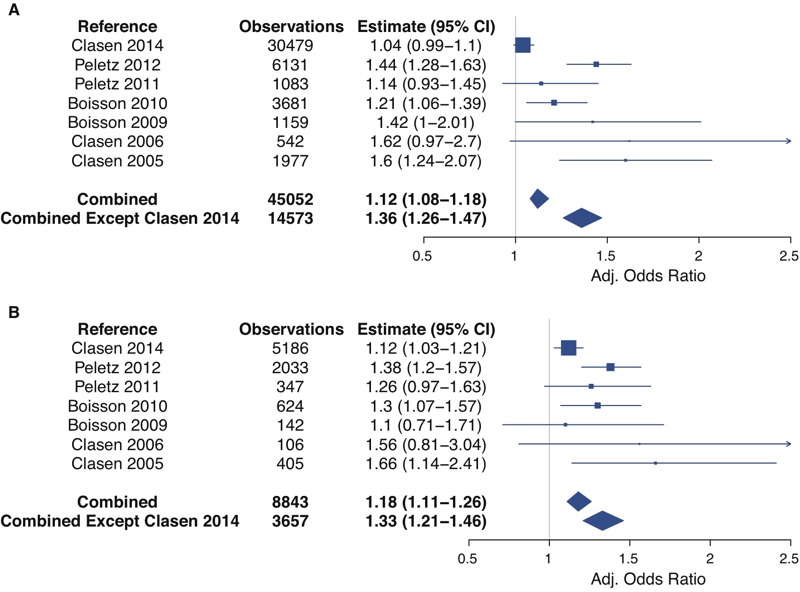
Figure 1.

Forest plot of adjusted odds ratios from multi-level logistic regression model with log10 TTC as a continuous predictor for all ages (A) and for children under 5 (B). All ages models are adjusted for age as a categorical variable (< 5, 5–15, > 15) and season. Models for children under 5 are adjusted for age as a continuous variable and season. The summary measures are also adjusted for study location. Study-specific point estimates are proportional to the number of observations.
