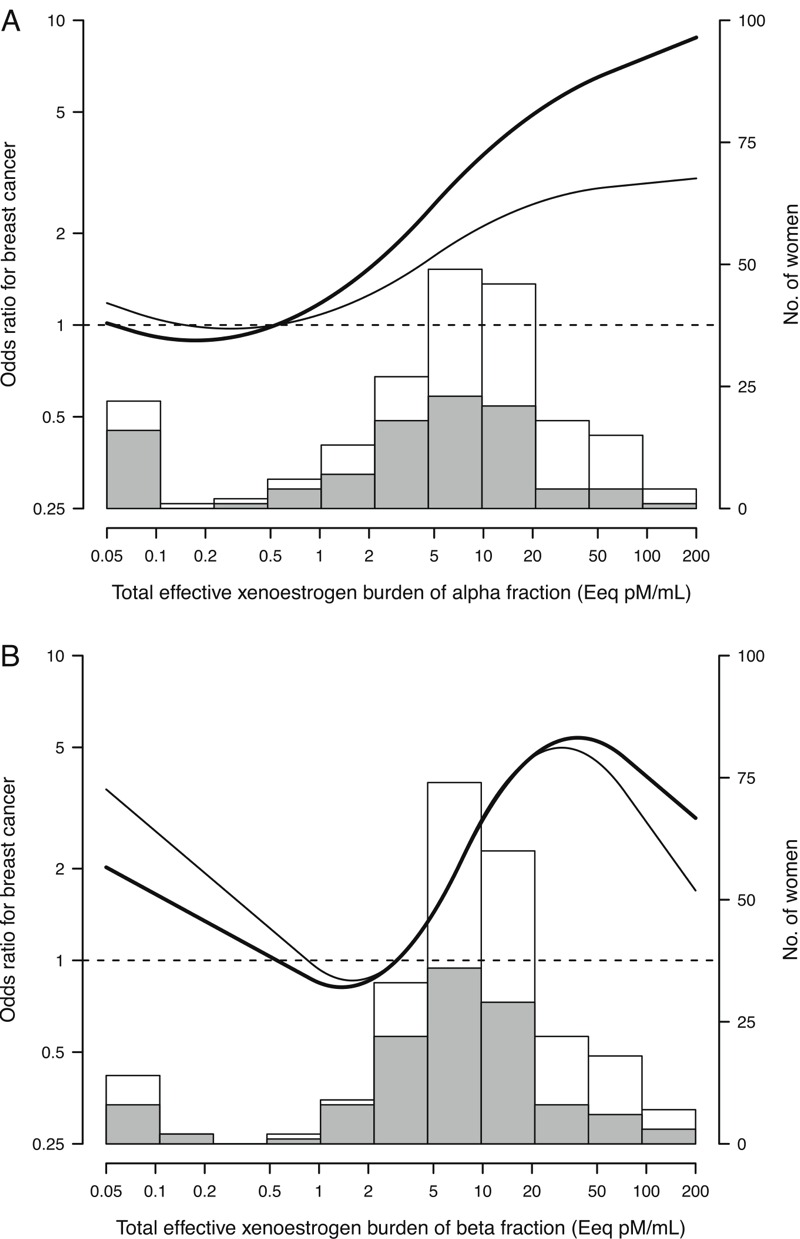
Figure 1.

Odds ratios for breast cancer by serum levels of total effective xenoestrogen burden of alpha (A) and beta (B) fractions. Curves represent adjusted odds ratios based on restricted quadratic splines for log-transformed levels of total effective xenoestrogen burden of alpha and beta fractions with knots at the 10th, 50th, and 95th percentiles. The reference value (odds ratio = 1) was set at the 20th percentile of each fraction distribution among controls (0.54 and 2.97 Eeq pM/mL for alpha and beta fractions, respectively). Odd ratios were adjusted for province, age, body mass index, education level, serum total lipid levels, smoking status, number of births, age at first birth, menopausal status, use of hormone replacement therapy, previous breast biopsy, and family history of breast cancer (bold curves), and further adjusted for the other fraction of total effective xenoestrogen burden (thin curves). Histograms represent each fraction distribution among controls (shaded bars) and breast cancer cases (white bars).
