
Figure 1.
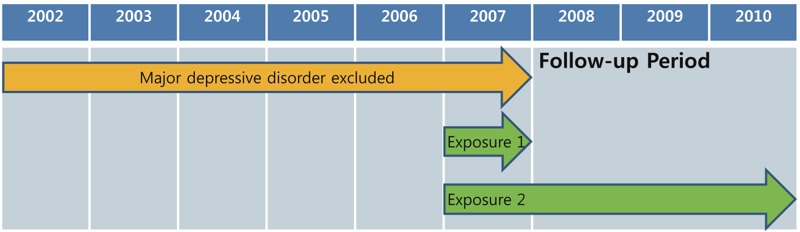
Schematic representation of the study period. Exposure 1: average PM2.5 concentration in 2007; exposure 2: average PM2.5 concentration between 2007 and 2010. PM2.5, particulate matter with an aerodynamic diameter ≤ 2.5 μm.
Official websites use .gov
A
.gov website belongs to an official
government organization in the United States.
Secure .gov websites use HTTPS
A lock (
) or https:// means you've safely
connected to the .gov website. Share sensitive
information only on official, secure websites.
Schematic representation of the study period. Exposure 1: average PM2.5 concentration in 2007; exposure 2: average PM2.5 concentration between 2007 and 2010. PM2.5, particulate matter with an aerodynamic diameter ≤ 2.5 μm.