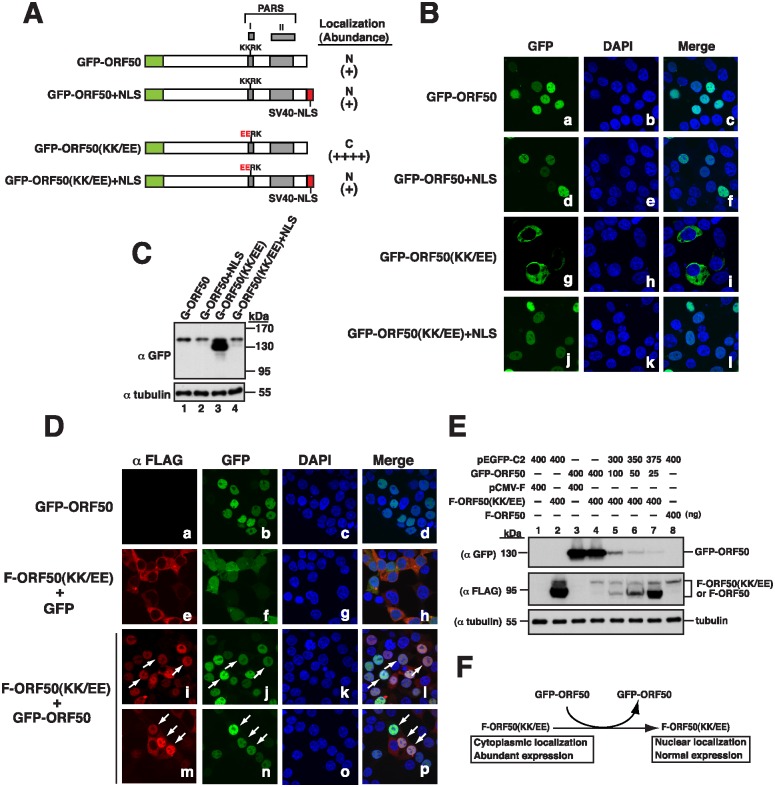
Fig 3. Nuclear translocation of ORF50(KK/EE) and its abundance.
(A) Schematic diagram of GFP-ORF50 and GFP-ORF50(KK/EE) constructs with or without an appendage of the SV40 NLS. The subcellular localization and protein abundance of each GFP fusion construct determined by confocal microscopy (B) and by immunoblot analysis (C) are summarized. (D) Confocal images of both F-ORF50(KK/EE) and GFP-tagged proteins expressed in 293T cells. Cells were cotransfected with plasmids expressing F-ORF50(KK/EE) and GFP or GFP-ORF50 for 24 hr. Intracellular localization of F-ORF50(KK/EE) (red) and GFP or GFP-ORF50 (green) in cells was analyzed by confocal microscopy. Arrows indicate the cells expressing both F-ORF50(KK/EE) and GFP-ORF50. (E) Changes in the expression of F-ORF50(KK/EE) by coexpression with GFP-ORF50. Various amounts of the GFP-ORF50 expression plasmid (0, 25, 50, 100 and 400 ng) were cotransfected with 400 ng of the F-ORF50(KK/EE) expression plasmid into 293T cells. The expression levels of F-ORF50(KK/EE) and GFP-ORF50 in cells were determined by immunoblotting using anti-FLAG and anti-GFP antibody, respectively. The expression of wild-type F-ORF50 in 293T cells was also included in the experiment (lane 8). (F) Summary of phenotypic changes of F-ORF50(KK/EE) in the presence of GFP-ORF50.

