
Figure 1.
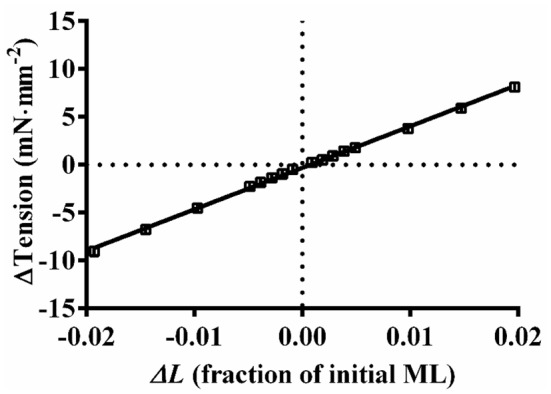
Relationship between changes in the steady-state force responses and the imposed muscle length changes. Five individual mouse fiber bundles (α-MHC) were subjected to various amplitude stretch/release perturbations (ΔL; ±0.1%, ±0.2%, ±0.3%, ±0.4%, ±0.5%, ±1.0%, ±1.5%, and ±2.0% of ML) and the corresponding steady-state force responses (ΔT) were recorded. The trace connecting the data (squares) represents the linear regression fit for the averaged ΔT-ΔL relationship from five muscle fiber bundles. The r2 value of the linear regression fit was 0.998, clearly indicating that the force scaled linearly with ML. Data are presented as mean ± SE. Standard error bars are smaller than symbols.