
FIGURE 3.
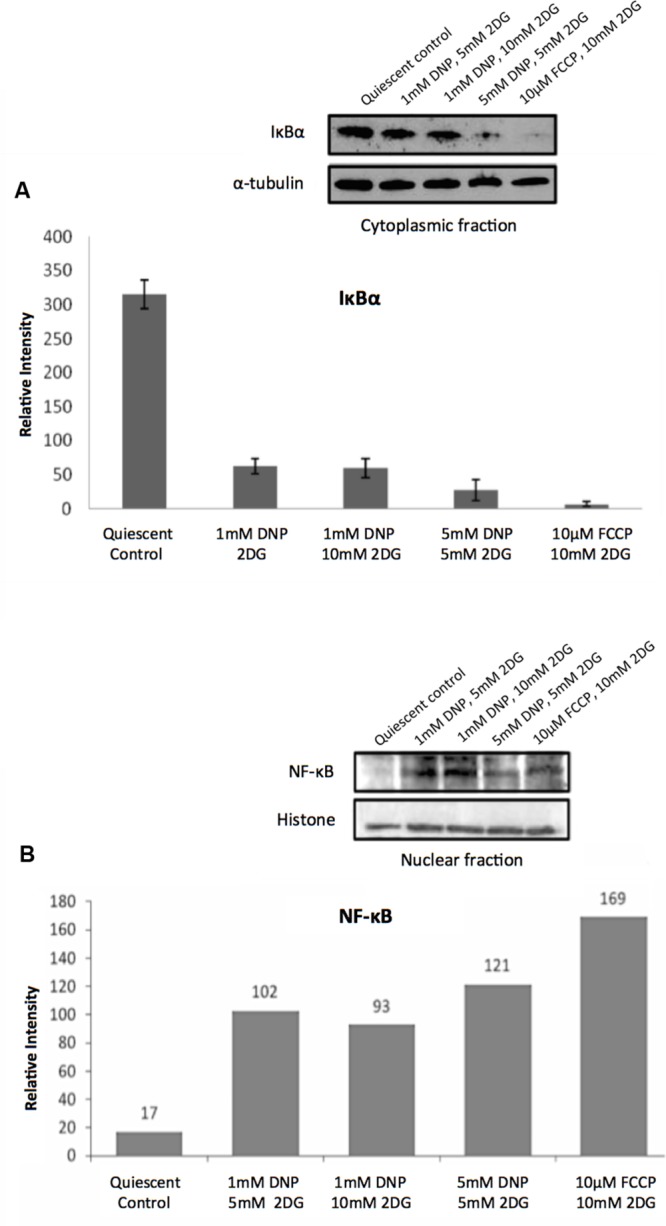
Regulation of NF-κB activity in response to energy starvation. (A) Effects of glycolysis inhibitors and mitochondrial uncouplers on IκBα expression levels in cytoplasmic fractions. The bar graph shows results of densitometric analysis of Western blot band intensities normalized to α-tubulin expression (means and standard deviations from three independent experiments). The differences between the control and treatments are significant (t-test, p < 0.001). (B) Effects of glycolysis inhibitors and mitochondrial uncouplers on NF-κBp65 (phospho S276) levels in the nuclear fractions. Densitometric analysis of Western blot band intensities shown are normalized to histone loading control.